. 2011 Feb;108(2):395-403.
doi: 10.1002/bit.22916.

Cellular arrays for large-scale analysis of transcription factor activity

Affiliations

Cellular arrays for large-scale analysis of transcription factor activity

Abigail D Bellis et al. Biotechnol Bioeng. 2011 Feb.

Abstract

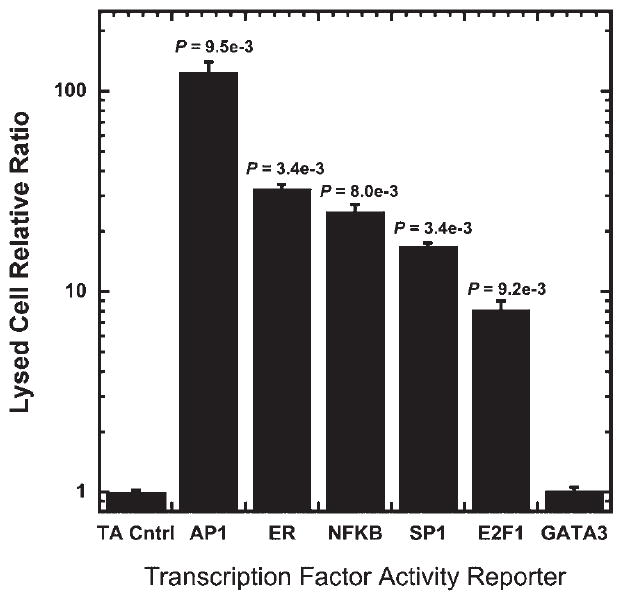
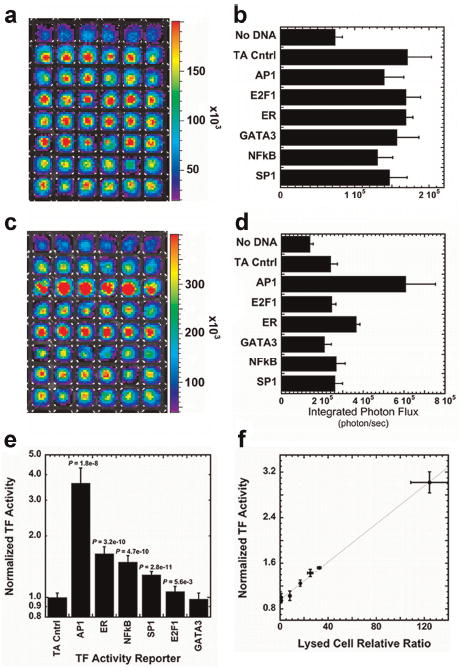
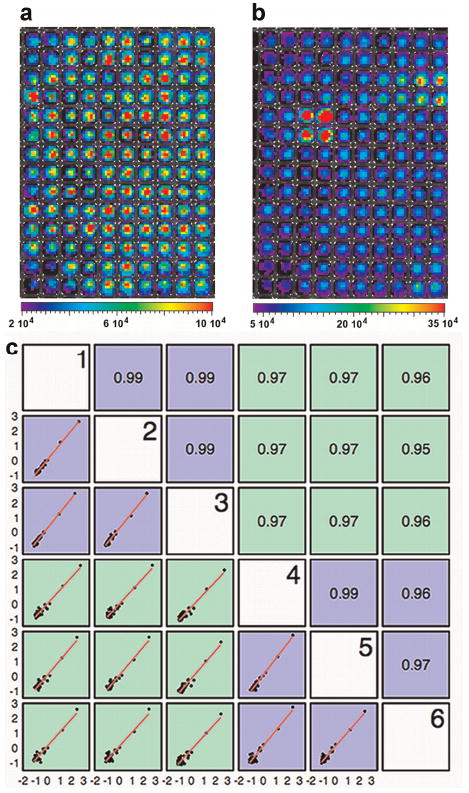
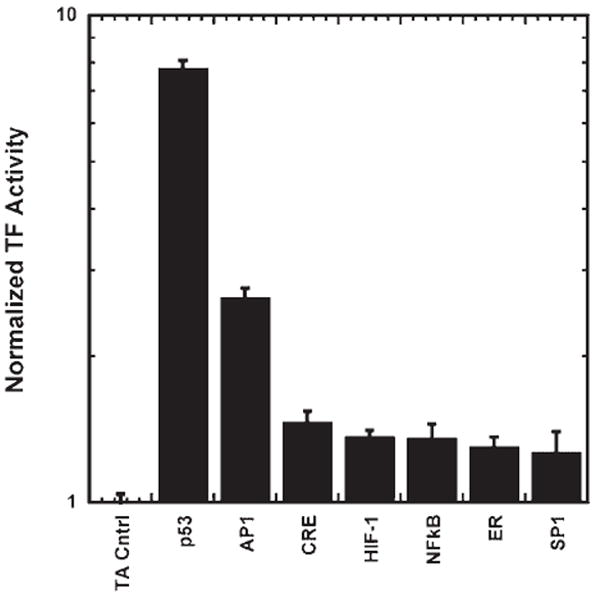
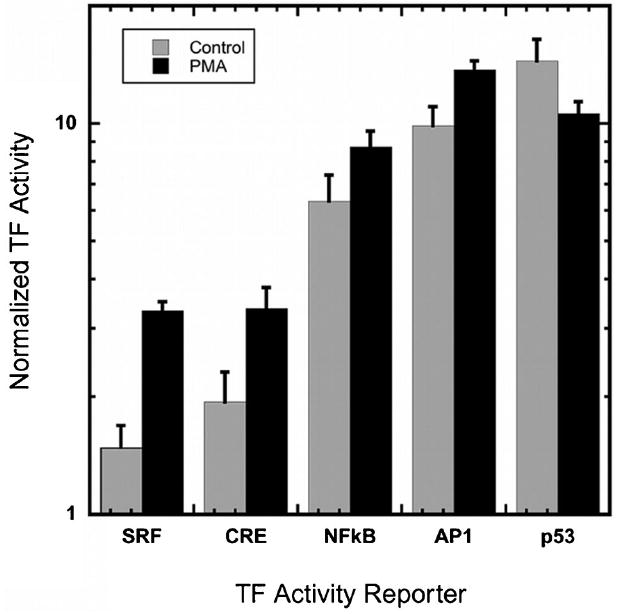
Identifying molecular mechanisms or therapeutic targets is typically based on large-scale cellular analysis that measures the abundance of mRNA or protein; however, abundance does not necessarily correlate with activity. We report a method for direct large-scale quantification of active pathways that employs a cellular array with parallel gene delivery of constructs that report pathway activity. The reporter constructs encode luciferase, whose expression is influenced by binding of transcription factors (TFs), which are the downstream targets of signaling pathways. Luciferase levels are quantified by bioluminescence imaging (BLI), which allows for rapid, non-invasive measurements. Activity profiles by BLI of 32 TFs were robust, consistent, and reproducible, and correlated with standard cell lysis techniques. The array identified five TFs with differential activity during phorbol-12-myristate-13-acetate (PMA)-induced differentiation of breast cancer cells. A system for rapid, large-scale, BLI quantification of pathway activity provides an enabling technology for mechanistic studies of cellular responses and processes.


Figures

Figure 1
Figure 1
Dual-luciferase reporter assay to measure TF activity. MCF-7:WS8 cells were transfected in parallel with reporter constructs containing enhancer elements for specific TFs (AP1, ER, NFκB, SP1, E2F1, and GATA3) and TA vector control in combination with a Renilla luciferase reporter to normalize for transfection. Cells were lysed 24 h after transfection and TF activitywas quantified using a dual-luciferase assay. Values are means ± SD of three independent experiments done in triplicate.
Figure 2
Figure 2
Dual-luciferase reporter constructs to measure TF activity. Dual-luciferase levels were analyzed using bioluminescence imaging 24 h after transfection by first imaging for Renilla luciferase (a and b) and then imaging each array for firefly luciferase (c and d). a and c: Pseudo-color mapping of photon flux localized within wells of the array were quantified to determine average photon fluxes for each well (b and d). e: The raw output for the firefly photon flux of each well was normalized by the photon emission from Renilla luciferase to produce the normalized light emission. f: The TF activity profile for MCF7:WS8 cells using lysed and live cell assays were directly compared using linear regression. The TF activity results were highly correlated (R2 = 0.999). [Color figure can be seen in the online version of this article, available at wileyonlinelibrary.com.]
Figure 3
Figure 3
Transfected cell array for the large-scale analysis of the activity of 32 TFs using BLI. Pseudo-colored image of light emission within wells of a 384-well plate upon subsequent addition of substrates for Renilla luciferase (a) and firefly luciferase (b). c: Linear regression comparison between arrays within and across experiments. TF activity profiles between six arrays formed in two independent experiments are highly correlated within experiments (blue comparisons) and across experiments (green comparisons) with a minimum correlation coefficient of 0.95. [Color figure can be seen in the online version of this article, available at wileyonlinelibrary.com.]
Figure 4
Figure 4
Transfected cell array for the large-scale analysis of the activity of 32 TFs using BLI. The normalized TF activity profile identified seven TFs with activities significantly higher than the TA vector control.
Figure 5
Figure 5
Changes in normalized TF activity profile of MCF7 cells upon induction with PMA. Of the 32 TFs in the array, 5 TFs had differential activity in response to PMA treatment, 4 TFs had increased activity upon PMA induction over vehicle delivery, SRF (+124%), CRE (+73%), NFκB (+38%), and AP1 (+39%), and 1 TF decreased in activity as compared to vehicle delivery (−26%).

References

    1. Abdel-Mageed AB, Agrawal KC. Activation of nuclear factor kappaB: Potential role in metallothionein-mediated mitogenic response. Cancer Res. 1998;58(11):2335–2338. - PubMed
    1. Adiseshaiah P, Peddakama S, Zhang Q, Kalvakolanu DV, Reddy SP. Mitogen regulated induction of FRA-1 proto-oncogene is controlled by the transcription factors binding to both serum and TPA response elements. Oncogene. 2005;24(26):4193–4205. - PubMed
    1. Ariazi EA, Kraus RJ, Farrell ML, Jordan VC, Mertz JE. Estrogenrelated receptor alpha1 transcriptional activities are regulated in part via the ErbB2/HER2 signaling pathway. Mol Cancer Res. 2007;5(1):71–85. - PubMed
    1. Bale TL, Dorsa DM. NGF, cyclic AMP, and phorbol esters regulate oxytocin receptor gene transcription in SK-N-SH and MCF7 cells. Brain Res Mol Brain Res. 1998;53(1–2):130–137. - PubMed
    1. Barnes PJ. Transcription factors in airway diseases. Lab Invest. 2006;86(9):867–872. - PubMed

Publication types

MeSH terms

LinkOut - more resources