. 2010;9(1):Article29.
doi: 10.2202/1544-6115.1434. Epub 2010 Aug 6.

Generalizing moving averages for tiling arrays using combined p-value statistics

Affiliations

Generalizing moving averages for tiling arrays using combined p-value statistics

Katerina J Kechris et al. Stat Appl Genet Mol Biol. 2010.

Abstract

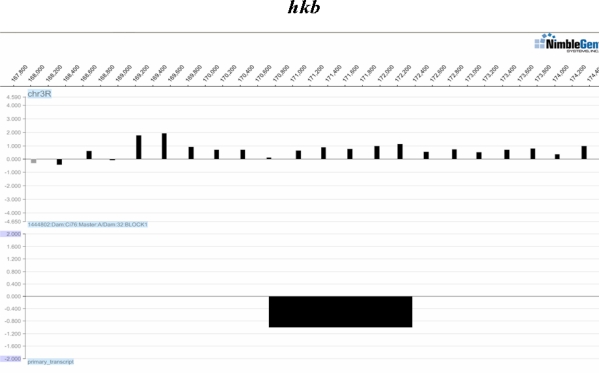
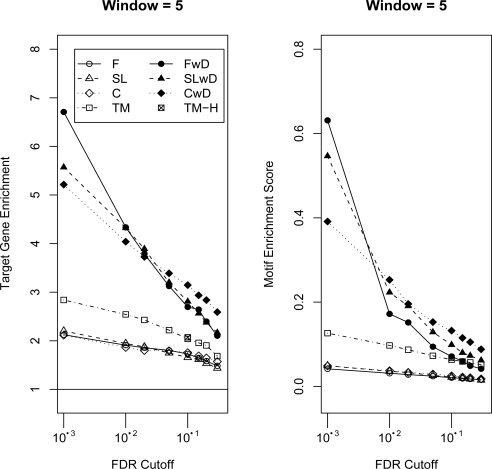
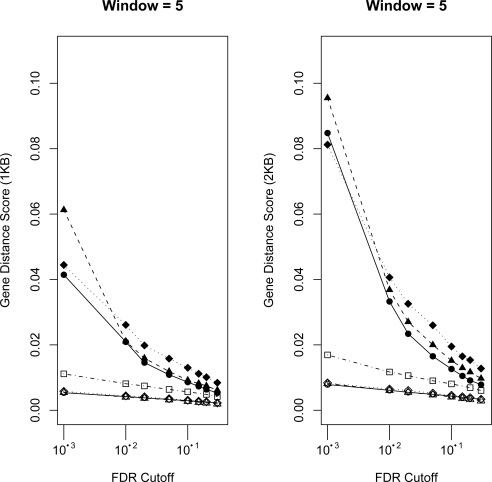
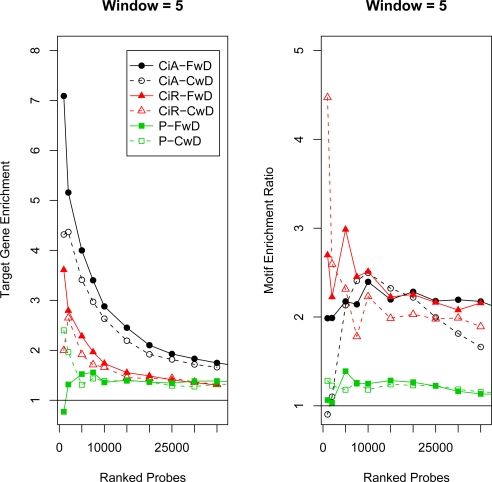
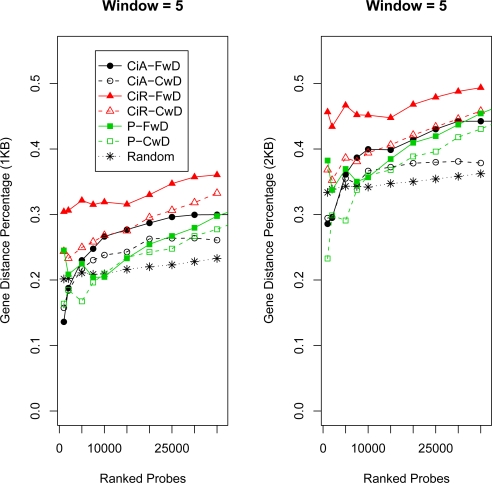
High density tiling arrays are an effective strategy for genome-wide identification of transcription factor binding regions. Sliding window methods that calculate moving averages of log ratios or t-statistics have been useful for the analysis of tiling array data. Here, we present a method that generalizes the moving average approach to evaluate sliding windows of p-values by using combined p-value statistics. In particular, the combined p-value framework can be useful in situations when taking averages of the corresponding test-statistic for the hypothesis may not be appropriate or when it is difficult to assess the significance of these averages. We exhibit the strengths of the combined p-values methods on Drosophila tiling array data and assess their ability to predict genomic regions enriched for transcription factor binding. The predictions are evaluated based on their proximity to target genes and their enrichment of known transcription factor binding sites. We also present an application for the generalization of the moving average based on integrating two different tiling array experiments.


Figures

Figure 1:
Figure 1:
Example of Data. The chromosome arm and positions are indicated on top. The first row shows log ratio intensity values (y-axis) in a region of the chromosome for one replicate. The second row indicates the location of the hkb gene (y-axis is for illustrative purposes). Plots were produced using the SignalMap software (NimbleGen).
Figure 2:
Figure 2:
Auto Correlation for Chromosome Arm 2R in the Three Data Sets. The y-axis is the robust estimate of the auto correlation described in Methods. The x-axis is the lag measured in number of probes
Figure 3:
Figure 3:
Target Gene and Motif Enrichment. The x-axis corresponds to probe-level FDR cutoffs for determining ERs. On the left, the y-axis corresponds to the “target gene enrichment ratio” (see Methods). Values greater than one, indicated by the line, correspond to relatively more target genes predicted than expected based on their frequency in the genome. On the right, the y-axis corresponds to the “motif enrichment score”, which is the motif enrichment ratio corrected for overall ER lengths (see Methods). Larger values correspond to relatively more motifs in the ERs than expected based on the frequency of the genome. The results are displayed for four combined p-value statistics, Fisher’s Combined Probability Test (F), Fisher’s Combined Probability Test with Dependence (FwD), Stouffer-Lipták Test (SL), Stouffer-Lipták Test with Dependence (SLwD), two moving average methods CMARRT (C), CMARRT with Dependence (CwD) and TileMap (TM) using FDR cutoffs or the HMM prediction method (TM-H). See Figures S2 and S3 for all window sizes.
Figure 4:
Figure 4:
Gene Distance Score. The x-axis corresponds to probe-level FDR cutoffs for determining ERs. The y-axis corresponds to the “gene distance score” corrected for overall ER lengths (see Methods). Larger values correspond to relatively more ERs close to genes. Distances less than or equal to 1KB and 2KB are used. See Figure 3 for details on legend and Figure S4 and S5 for all window sizes.
Figure 5:
Figure 5:
Target Gene and Motif Enrichment for Top Predictions. The x-axis corresponds to the number of top ranked probes used to construct ERs. On the left, the y-axis corresponds to the “target gene enrichment ratio” (see Methods). Values greater than one, indicated by the line, correspond to relatively more target genes predicted than expected based on their frequency in the genome. On the right, the y-axis corresponds to the “motif enrichment ratio” (see Methods). Values greater than one, indicated by the line, correspond to relatively more motifs in the ERs than expected by what is observed in the overall genome. The results are displayed for Fisher’s Combined Probability Test with Dependence (FwD) and the moving average method CMARRT with Dependence (CwD). See Figure 3 for details and Figures S6 and S7 for all window sizes.
Figure 6:
Figure 6:
Gene Distance Percentage for Top Predictions. The x-axis corresponds to probe-level FDR cutoffs for determining ERs. The y-axis corresponds to the “gene distance percentage” (see Methods). Larger values correspond to relatively more ERs close to genes. Distances less than or equal to 1KB and 2KB are used. See Figure 5 for details and Figure S8 and S9 for all window sizes.

References

    1. Alexandre C, Jacinto A, Ingham P. “Transcriptional Activation of hedgehog Target Genes in Drosophila is Mediated Directly by the Cubitus interruptus Protein, a Member of the GLI Family of Zinc Finger DNA-Binding Proteins,”. Genes and Development. 1996;10:2003–2013. doi: 10.1101/gad.10.16.2003. - DOI - PubMed
    1. Beissbarth T, Speed T. “GOstat: Find Statistically Overrepresented Gene Ontologies within a Group of Genes,”. Bioinformatics. 2004;20:1464–1465. doi: 10.1093/bioinformatics/bth088. - DOI - PubMed
    1. Benjamini Y, Hochberg Y. “Controlling the False Discovery Rate - A Practical and Powerful Approach to Multiple Testing,”. Journal of the Royal Statistical Society Series B-Methodological. 1995;57:289–300.
    1. Bourgon R. Chromatin-Immunoprecipitation and High-Density Tiling Microarrays: A Generative Model, Methods for Analysis, and Methodology Assessment in the Absence of a ”Gold Standard”. 2006. PhD thesis, University of California, Berkeley.
    1. Brown M. “A Method for Combining Non-Independent, One-Sided Tests of Significance,”. Biometrics. 1975;31:987–992. doi: 10.2307/2529826. - DOI

Publication types

MeSH terms

Substances

LinkOut - more resources