. 2010 Dec 1;432(2):407-16.
doi: 10.1042/BJ20100041.

Similarities and differences in the structure and function of 4.1G and 4.1R135, two protein 4.1 paralogues expressed in erythroid cells

Affiliations

Similarities and differences in the structure and function of 4.1G and 4.1R135, two protein 4.1 paralogues expressed in erythroid cells

Wataru Nunomura et al. Biochem J. .

Abstract

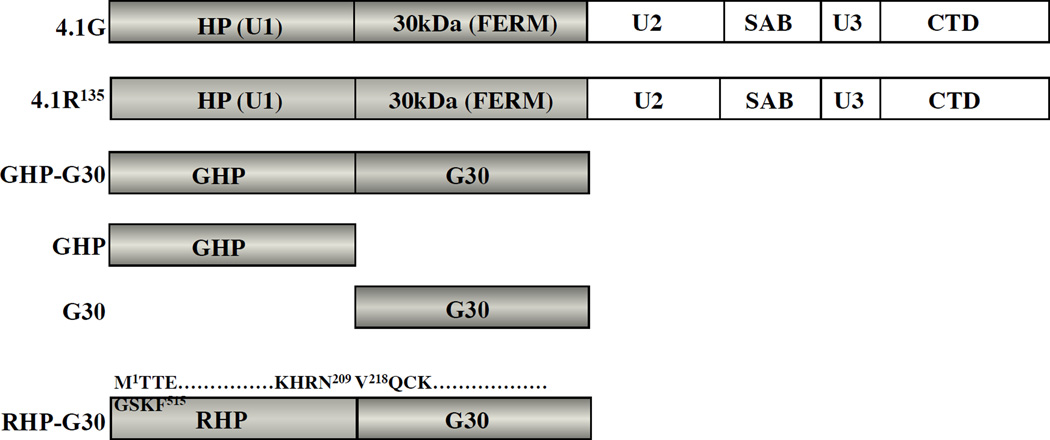
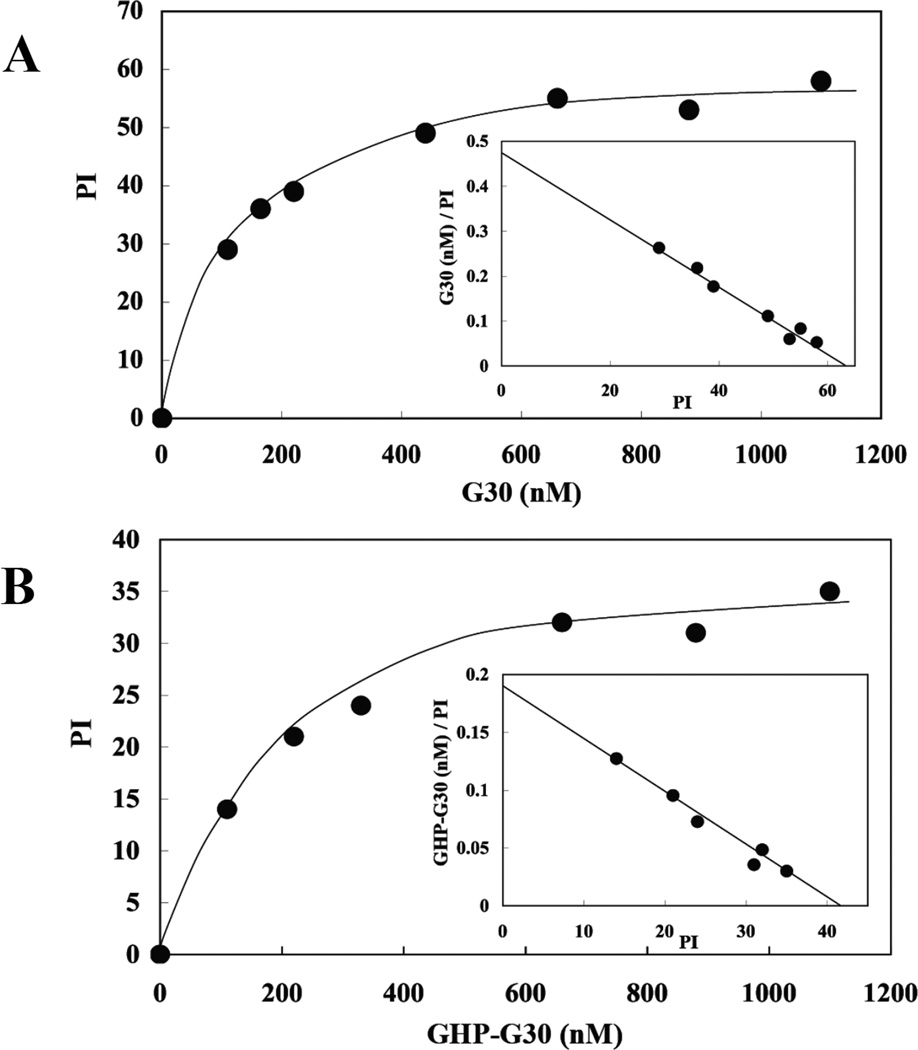
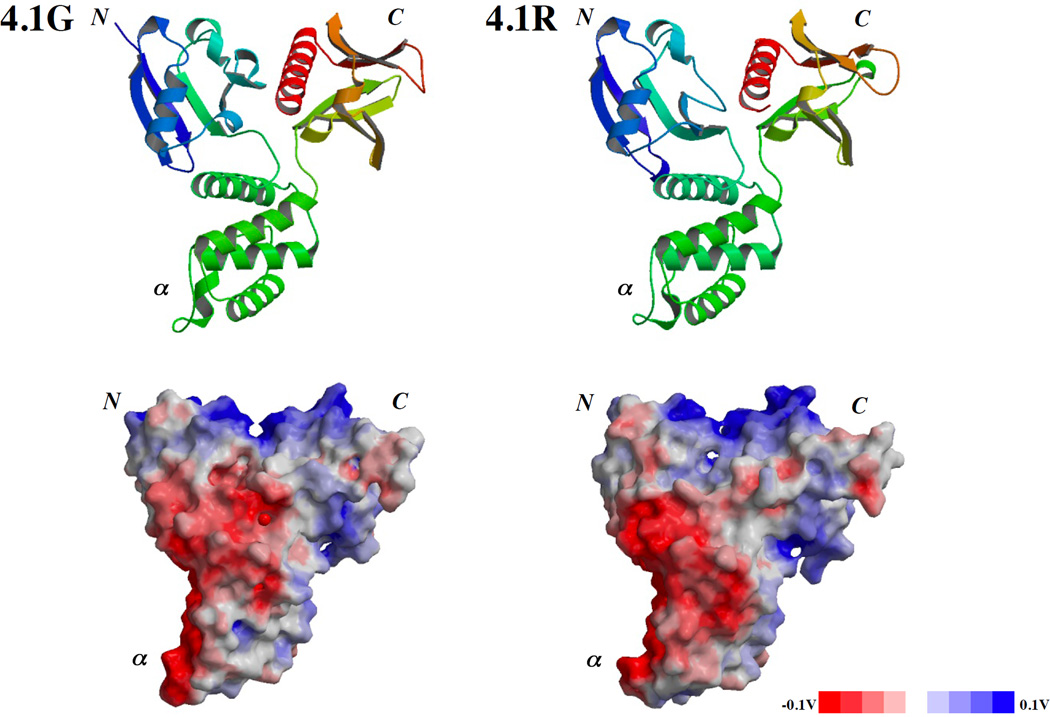
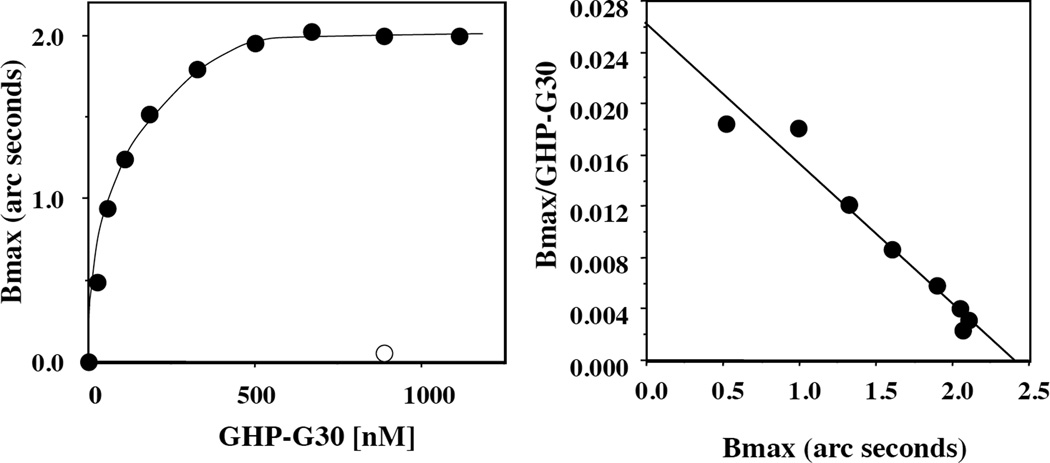
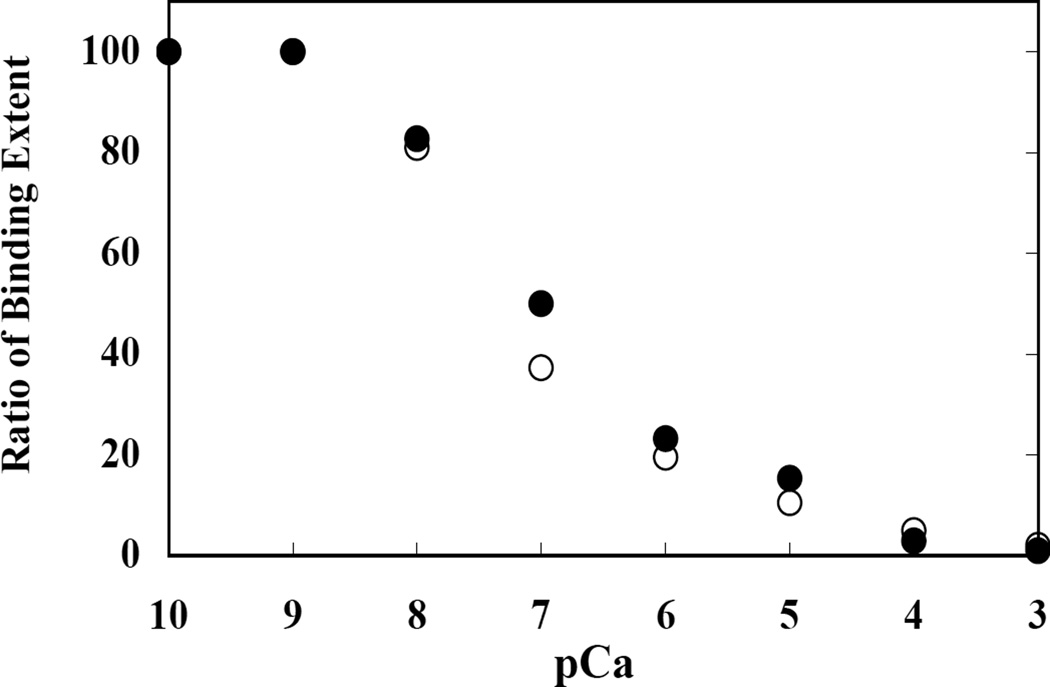
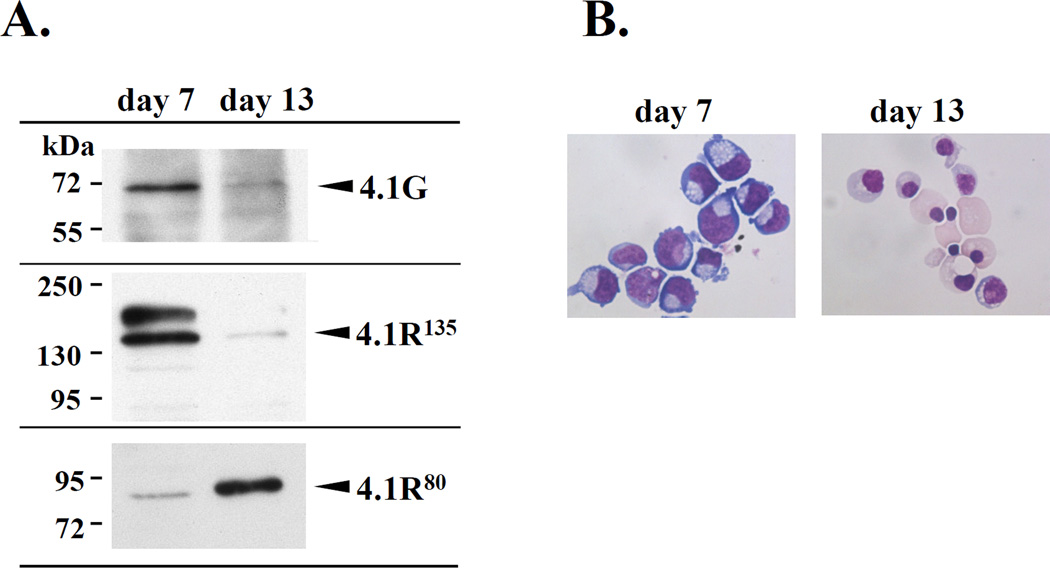
Membrane skeletal protein 4.1R is the prototypical member of a family of four highly paralogous proteins that include 4.1G, 4.1N and 4.1B. Two isoforms of 4.1R (4.1R135 and 4.1R80), as well as 4.1G, are expressed in erythroblasts during terminal differentiation, but only 4.1R80 is present in mature erythrocytes. Although the function of 4.1R isoforms in erythroid cells has been well characterized, there is little or no information on the function of 4.1G in these cells. In the present study, we performed detailed characterization of the interaction of 4.1G with various erythroid membrane proteins and the regulation of these interactions by calcium-saturated calmodulin. Like both isoforms of 4.1R, 4.1G bound to band 3, glycophorin C, CD44, p55 and calmodulin. While both 4.1G and 4.1R135 interact with similar affinity with CD44 and p55, there are significant differences in the affinity of their interaction with band 3 and glycophorin C. This difference in affinity is related to the non-conserved N-terminal headpiece region of the two proteins that is upstream of the 30 kDa membrane-binding domain that harbours the binding sites for the various membrane proteins. The headpiece region of 4.1G also contains a high-affinity calcium-dependent calmodulin-binding site that plays a key role in modulating its interaction with various membrane proteins. We suggest that expression of the two paralogues of protein 4.1 with different affinities for band 3 and glycophorin C is likely to play a role in assembly of these two membrane proteins during terminal erythroid differentiation.


Figures

Figure 1
Figure 1. Structure of 4.1G, 4.1R and various 4.1G constructs used in this study
4.1R135 consists of a 209 amino acids headpiece region (HP), a 298 amino acids 30kDa domain (FERM domain), a 10kDa spectrin-actin binding domain (SAB), and a 22/24kDa carboxy-terminal domain (CTD). The headpiece is also referred to as unique region 1 (U1) whereas the 16kDa domain between the 30kDa domain and the SAB domain and the domain between the SAB domain and the CTD domain are referred to as unique region 2 (U2) and 3 (U3), respectively. The apparent molecular weights of SAB and CTD are 10kDa and 22/24kDa based on the migration of fragments obtained after α-chymotryptic digestion of 4.1R80 [1]. The accession number for human 4.1R135 is P11171. The primary structure of 4.1G is registered under accession No. AAC16923. The amino acid sequence identity between 4.1R135 and 4.1G HPs (RHP and GHP) and between 30kDa domains 4.1R135 and 4.1G (G30) is displayed (35% and 71%, respectively). Various domains of 4.1R135 and 4.1G used in binding assays are depicted including a chimera protein corresponding to 4.1R135 HP and 4.1G 30kDa domain, RHP-G30. The amino acid sequences at the boundary of each domain of this chimera protein are displayed, the amino acid numbering for each domain referring to the protein of origin.
Figure 2
Figure 2. Binding profiles of 4.1G 30kDa domain (G30) and GHP-G30 polypeptide binding to human erythrocyte inside-out-vesicles (IOVs)
G30 and GHP-G30 at different concentrations were incubated with IOVs and the IOVs were subsequently pelleted by centrifugation. The photometric intensity (PI) of IOVs bound G30 (A) and GHP-G30 (B) in the pellet was measured by densitometry. The PI values are plotted as a function of protein concentration and the Scatchard plots are shown in the inserts.
Figure 3
Figure 3. in silico prediction of 3D structure of 4.1G 30kDa domain
Predicted ribbon model (upper panel) and surface charge distribution (bottom panel) for 4.1G (left column) based on the defined structure of 4.1R 30kDa domain (upper and lower panels in right column; PDB accession No.1GG3). N, α and C present N-lobe, α-lobe and C-lobe, respectively [26].
Figure 4
Figure 4. 4.1G and GHP binding to CaM Sepharose 4B
(A) Monitoring of non-tagged full length 4.1G purification on a 10% SDS-PAGE gel stained with Coomassie Brilliant Blue (See Materials and Methods). lane 1: bacterial lysate, lane 2: 35% saturated ammonium sulfate precipitate, lane 3: fraction after dialysis, lane 4: 50% saturated ammonium sulfate precipitate, lane 5: 50% saturated ammonium sulfate supernatant, lane 6: active fraction eluted from Q Sepharose column, lane 7: flow through fraction from CaM Sepharose 4B column in presence of Ca2+, lane 8: 5mM EGTA elution fraction from CaM-Sepharose 4B. The arrowhead indicates the position of purified full length 4.1G. (B) Elution profile of GST and of GHP from a CaM Sepharose 4B column in the presence of 1 mM CaCl2 and 5 mM EGTA, respectively. Protein elution is monitored by absorbance at 280 nm. (C) GHP binding to a CaM Sepharose 4B column was analyzed by SDS-PAGE (12% gel) stained with Coomassie Brilliant Blue. lane 1: GST-GHP fusion protein purified on a glutathione Sepharose column, lane 2: affinity purified thrombin-treated GST-GHP fusion protein, lanes 3: “1 mM CaCl2” flow through fractions shown in panel B enriched in GST (open arrowhead), lanes 4: 5 mM EGTA elution fractions shown in panel B and enriched in GHP (closed arrowhead). Note that GST as a control did not bind to CaM Sepharose 4B.
Figure 5
Figure 5. Analysis of GHP-G30 binding to CaM by Resonant Mirror Detection (RMD)
CaM was immobilized on an aminosilane cuvette. The binding assay was carried out in the presence of 1 mM Ca2+. The Bmax (arc seconds) at each GHP-G30 concentration was calculated using the software package Fastfit® and Bmax is plotted against the ratio Bmax/concentration of added GHP-G30 (Bmax/GHP-G30). The maximum binding (Bmax) at the crossing point on the X-axis was 2.4. The half maximum binding occurred at 87nM of GHP-G30, an affinity that is similar to the K(D) value calculated from kinetic binding analysis (44nM, Table 2). Open circle presents the Bmax in the absence of Ca2+.
Figure 6
Figure 6. Ca2+ concentration dependence of 4.1G (GHP-G30) binding to the cytoplasmic domain of band 3 and GPC
GHP-G30 binding to cytoplasmic domain of band 3 (●) and GPC (○) was measured at various concentrations of Ca2+ either in the presence of 5 µM CaM. Ca2+ concentrations were maintained by a Ca2+/EGTA buffer system. The maximal extent of binding under different experimental conditions was quantitated as described under “Materials and Methods.” Maximal binding in the presence of EGTA was used to normalize the extent of binding under different experimental conditions. pCa represents ionized Ca2+ concentration. The extent of GHP-G30 binding to cytoplasmic domain of band 3 and GPC is plotted as a function of Ca2+ concentration. In the absence of CaM, there was no change in the binding of GHP-G30 to the cytoplasmic domain of the transmembrane proteins as a function of Ca2+ concentration (data not shown).
Figure 7
Figure 7. Expression of 4.1G, 4.1R135 and 4.1R80 during human erythroblast differentiation
(A) Immuno-blot analysis of protein extracts from human erythroblasts at early (day7) and late stages (day13) of differentiation (see “Materials and Methods”) using antibodies specific for 4.1G and 4.1R. (B) Cellular morphology was assessed by cytospin on a daily basis followed by May-Grünwald Giemsa staining and light microscopy (Magnification is X100).

References

    1. Diakowski W, Grzybek M, Sikorski AF. Protein 4.1, a component of the erythrocyte membrane skeleton and its related homologue proteins forming the protein 4.1/FERM superfamily. Folia Histochemica et Cyrobiologica. 2006;44:231–248. - PubMed
    1. Parra M, Gascard P, Walensky LD, Snyder SH, Mohandas N, Conboy JG. Cloning and characterization of 4.1G (EPB41L2), a new member of the skeletal protein 4.1 (EPB41) gene family. Genomics. 1998;49:298–306. - PubMed
    1. Walensky LD, Blackshaw S, Liao D, Watkins CC, Weier HUG, Parra M, Huganir RL, Conboy JG, Mohandas N, Snyder SH. A novel neuron-enriched homolog of the erythrocyte membrane cytoskeletal protein 4.1. J. Neuroscience. 1999;19:6457–6467. - PMC - PubMed
    1. Parra M, Gascard P, Walensky LD, Gimm JA, Blackshaw S, Chan N, Takakuwa Y, Berger T, Lee G, Chasis JA, Snyder SH, Mohandas N, Conboy JG. Molecular and functional characterization of protein 4.1B, a novel member of the protein 4.1 family with high level, focal expression in brain. J. Biol. Chem. 2000;275:3247–3255. - PubMed
    1. Conboy JG, Chan J, Mohandas N, Kan YW. Multiple protein 4.1 isoforms produced by alternative splicing in human erythroid cells. Proc Natl. Acad. Sci. USA. 1988;85:9062–9065. - PMC - PubMed

Publication types