

Comparison of two approaches for measuring household wealth via an asset-based index in rural and peri-urban settings of Hunan province, China
- PMID: 20813070
- PMCID: PMC2942820
- DOI: 10.1186/1742-7622-7-7
Comparison of two approaches for measuring household wealth via an asset-based index in rural and peri-urban settings of Hunan province, China
Abstract
Background: There are growing concerns regarding inequities in health, with poverty being an important determinant of health as well as a product of health status. Within the People's Republic of China (P.R. China), disparities in socio-economic position are apparent, with the rural-urban gap of particular concern. Our aim was to compare direct and proxy methods of estimating household wealth in a rural and a peri-urban setting of Hunan province, P.R. China.
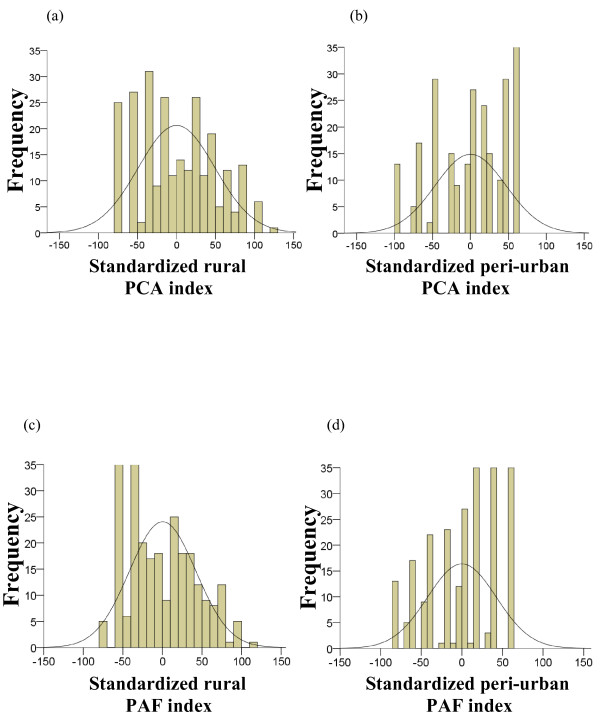
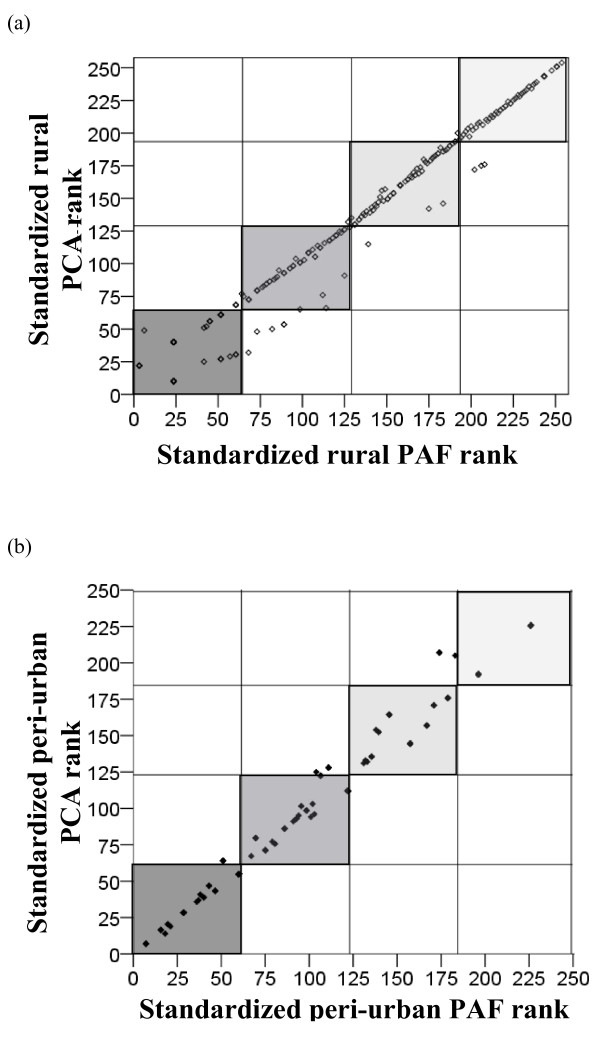
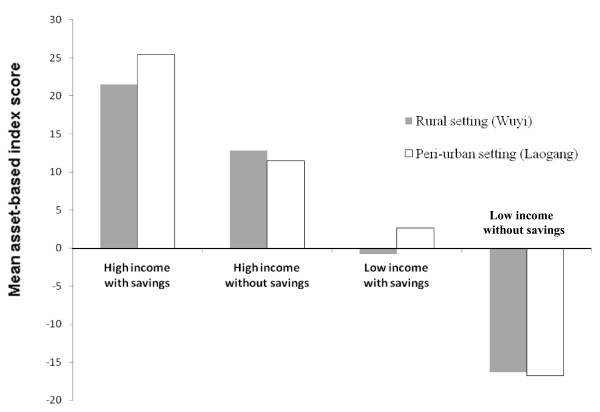
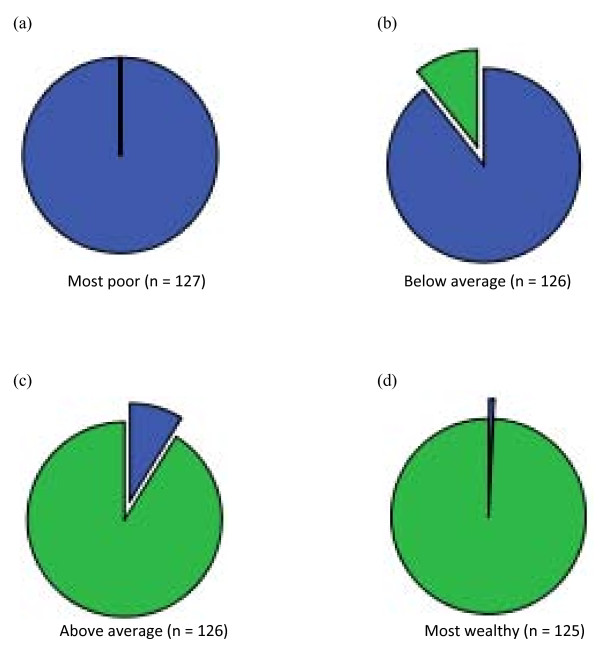
Methods: We collected data on ownership of household durable assets, housing characteristics, and utility and sanitation variables in two village-wide surveys in Hunan province. We employed principal components analysis (PCA) and principal axis factoring (PAF) to generate household asset-based proxy wealth indices. Households were grouped into quartiles, from 'most wealthy' to 'most poor'. We compared the estimated household wealth for each approach. Asset-based proxy wealth indices were compared to those based on self-reported average annual income and savings at the household level.
Results: Spearman's rank correlation analysis revealed that PCA and PAF yielded similar results, indicating that either approach may be used for estimating household wealth. In both settings investigated, the two indices were significantly associated with self-reported average annual income and combined income and savings, but not with savings alone. However, low correlation coefficients between the proxy and direct measures of wealth indicated that they are not complementary. We found wide disparities in ownership of household durable assets, and utility and sanitation variables, within and between settings.
Conclusion: PCA and PAF yielded almost identical results and generated robust proxy wealth indices and categories. Pooled data from the rural and peri-urban settings highlighted structural differences in wealth, most likely a result of localized urbanization and modernization. Further research is needed to improve measurements of wealth in low-income and transitional country contexts.
Figures
References
-
- Armstrong Schellenberg J, Victora CG, Mushi A, de Savigny D, Schellenberg D, Mshinda H, Bryce J. for the Tanzania IMCI MCE baseline household survey study group. Inequities among the very poor: health care for children in rural southern Tanzania. Lancet. 2003;361(9357):561–6. doi: 10.1016/S0140-6736(03)12515-9. - DOI - PubMed
LinkOut - more resources
Full Text Sources
Miscellaneous
