. 2010 Nov;299(5):G1204-10.
doi: 10.1152/ajpgi.00302.2010. Epub 2010 Sep 2.

Isolation of periportal, midlobular, and centrilobular rat liver sinusoidal endothelial cells enables study of zonated drug toxicity

Affiliations

Isolation of periportal, midlobular, and centrilobular rat liver sinusoidal endothelial cells enables study of zonated drug toxicity

Guanhua Xie et al. Am J Physiol Gastrointest Liver Physiol. 2010 Nov.

Abstract

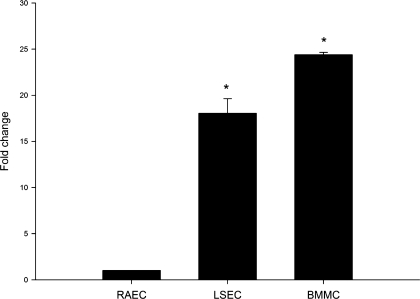
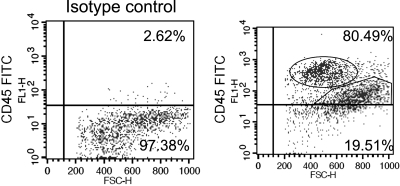
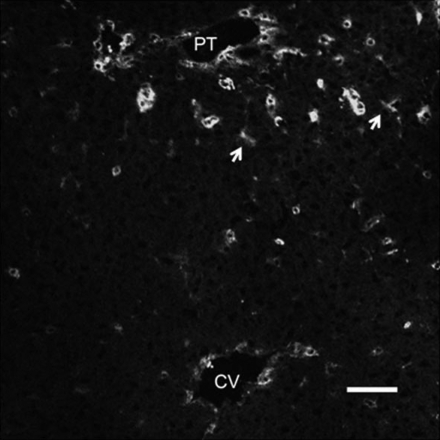
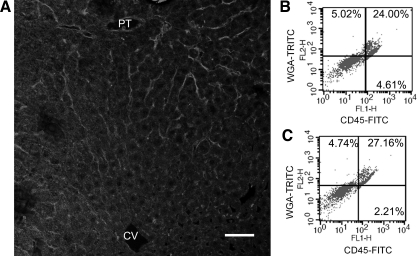
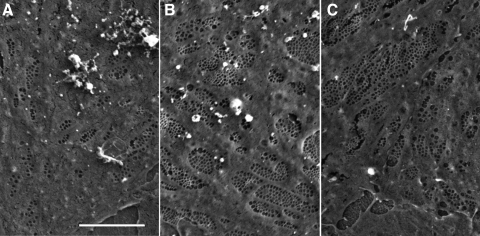
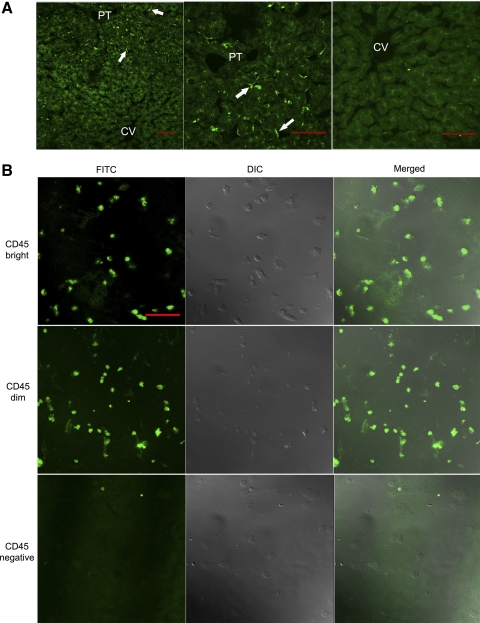
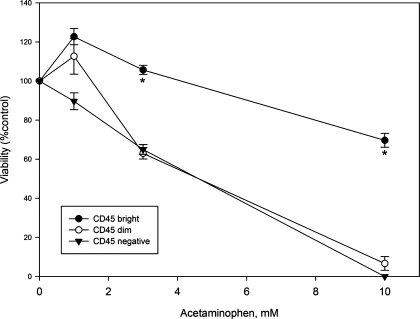
Many liver sinusoidal endothelial cell (LSEC)-dependent processes, including drug-induced liver injury, ischemia-reperfusion injury, acute and chronic rejection, fibrosis, and the HELLP (hemolytic anemia, elevated liver enzymes, low platelet count) syndrome, may have a lobular distribution. Studies of the mechanism of this distribution would benefit from a reliable method to isolate LSEC populations from different regions. We established and verified a simple method to isolate periportal, midlobular, and centrilobular LSEC. Three subpopulations of LSEC were isolated by immunomagnetic separation on the basis of CD45 expression. Flow cytometry showed that 78.2 ± 2.3% of LSEC were CD45 positive and that LSEC could be divided into CD45 bright (28.6 ± 2.7% of total population), dim (49.6 ± 1.0%), and negative populations (21.8 ± 2.3%). Immunohistochemistry confirmed that in vivo expression of CD45 in LSEC had a lobular distribution with enhanced CD45 staining in periportal LSEC. Cell diameter, fenestral diameter, number of fenestrae per sieve plate and per cell, porosity, and lectin uptake were significantly different in the subpopulations, consistent with the literature. Endocytosis of low concentrations of the LSEC-specific substrate, formaldehyde-treated serum albumin, was restricted to CD45 bright and dim LSEC. Acetaminophen was more toxic to the CD45 dim and negative populations than to the CD45 bright population. In conclusion, CD45 is highly expressed in periportal LSEC, low in midlobular LSEC, and negative in centrilobular LSEC, and this provides an easy separation method to isolate LSEC from the three different hepatic regions. The LSEC subpopulations obtained by this method are adequate for functional studies and drug toxicity testing.


Figures

Fig. 1.
Fig. 1.
Real-time PCR of CD45 expression in isolated liver sinusoidal endothelial cells (LSEC). CD45 mRNA expression in LSEC isolated from normal rat liver was quantified by real-time PCR. Rat bone marrow mononuclear cells (BMMC) were used as a positive control and rat aortic endothelial cells (RAEC) were used as a negative control. CD45 mRNA levels are significantly higher in LSEC and BMMC than RAEC (n = 4; P < 0.0001 for comparison of the 3 cell types by ANOVA; *P < 0.001 for comparison of LSEC and BMMC vs. RAEC by least significant difference test).
Fig. 2.
Fig. 2.
Flow cytometry of CD45 expression in isolated LSEC. LSEC isolated from normal rat liver were stained with isotype control antibody (left) or CD45-FITC (right) and examined by flow cytometry. Scatter plots are gated on CD45 and are representative of 4 independent experiments. The percentage of LSEC expressing CD45 is shown in each plot. Three populations could be observed in the right plot: CD45 bright (oval in top right), CD45 dim (polygon in top right), and CD45 negative (bottom right).
Fig. 3.
Fig. 3.
Immunohistochemistry of control rat liver stained for CD45. Frozen rat liver section was stained for CD45. Continuous staining was observed (arrow) along the sinusoids around the portal triad (PT) with no stain observed along the sinusoids around the central vein (CV). Scale bar: 50 μm.
Fig. 4.
Fig. 4.
Colocalization of wheat germ agglutinin (WGA) uptake with CD45 bright LSEC. A: livers were perfused with WGA- tetramethylrhodamine isothiocyanate (TRITC) and examined under confocal microscopy. Positive staining of LSEC, manifested as a continuous line along the sinusoids, was observed in the sinusoids around the PT with no staining observed in the sinusoids around the CV. Scale bar: 50 μm. B: LSEC isolated from WGA-TRITC-perfused rat liver were incubated in vitro with CD45-FITC and examined by flow cytometry. C: LSEC isolated from non-WGA-perfused rat liver were incubated in vitro with WGA-TRITC and CD45-FITC and examined by flow cytometry. Plots are gated on CD45 and WGA, and the percentage of cells positive for WGA only, for both CD45 and WGA, and for CD45 only are shown in top left, top right, and bottom right, respectively. The examples shown are representative of 3 independent experiments.
Fig. 5.
Fig. 5.
Scanning electron microscopy (SEM). LSEC were isolated and separated into CD45 bright, dim, and negative subpopulations as described in materials and methods. Cells were cultured overnight, processed, and examined by SEM at ×5,000 magnification. Note that the cells in the CD45 bright population (A) have fewer fenestrae than the cells in the CD45 dim (B) and the CD45 negative (C) populations. Scale bar: 5 μm.
Fig. 6.
Fig. 6.
Uptake of FITC-labeled formaldehyde-treated serum albumin (FITC-FSA) by LSEC. A: livers were perfused with FITC-FSA and examined by confocal microscopy. Left, ×20 magnification; middle and right, ×40 magnification of the same field as left. Uptake of FITC-FSA (arrow) was observed in the sinusoids around the PT with no uptake was observed in the sinusoids around the CV. Scale bar: 50 μm. B: CD45 bright, dim, and negative populations were exposed to 0.02 μg/ml FITC-FSA as described in materials and methods. Uptake of FITC-FSA was observed in both CD45 bright and dim populations, whereas no uptake was observed in the CD45 negative population. DIC, differential interference contrast. Scale bar: 50 μm.
Fig. 7.
Fig. 7.
Toxicity of acetaminophen to CD45 bright (periportal), CD45 dim (midlobular), and CD45 negative (centrilobular) LSEC. CD45 bright (●), CD45 dim (○), and CD45 negative (▾) LSEC were exposed to acetaminophen, 1, 3, and 10 mM, overnight as described in materials and methods. Acetaminophen is significantly more toxic to CD45 dim and CD45 negative cells than to CD45 bright cells (n = 3; P < 0.0001 for comparison of the 3 subpopulations by ANOVA; *P < 0.001 for comparison of CD45 dim and negative vs. CD45 bright at 3 and 10 mM by least significant difference test).

References

    1. Aarnoudse JG, Houthoff HJ, Weits J, Vellenga E, Huisjes HJ. A syndrome of liver damage and intravascular coagulation in the last trimester of normotensive pregnancy. A clinical and histopathological study. Br J Obstet Gynaecol 93: 145–155, 1986 - PubMed
    1. Asumendi A, Alvarez A, Martinez I, Smedsrød B, Vidal-Vanaclocha F. Hepatic sinusoidal endothelium heterogeneity with respect to mannose receptor activity is interleukin-1 dependent. Hepatology 23: 1521–1529, 1996 - PubMed
    1. Barberá-Guillem E, Rocha M, Alvarez A, Vidal-Vanaclocha F. Differences in the lectin-binding patterns of the periportal and perivenous endothelial domains in the liver sinusoids. Hepatology 14: 131–139, 1991 - PubMed
    1. Caldwell-Kenkel C, Thurman RG, Lemasters JJ. Selective loss of nonparenchymal cell viability after cold ischemic storage of rat livers. Transplantation 45: 834–837, 1988 - PubMed
    1. Caldwell-Kenkel JC, Currin RT, Tanaka Y, Thurman RG, Lemasters JJ. Reperfusion injury to endothelial cells following cold ischemic storage of rat livers. Hepatology 10: 292–299, 1989 - PubMed

Publication types

MeSH terms