. 2010 Oct;177(4):2067-79.
doi: 10.2353/ajpath.2010.100079. Epub 2010 Sep 2.

Site-dependent E-cadherin cleavage and nuclear translocation in a metastatic colorectal cancer model

Affiliations

Site-dependent E-cadherin cleavage and nuclear translocation in a metastatic colorectal cancer model

María Virtudes Céspedes et al. Am J Pathol. 2010 Oct.

Abstract

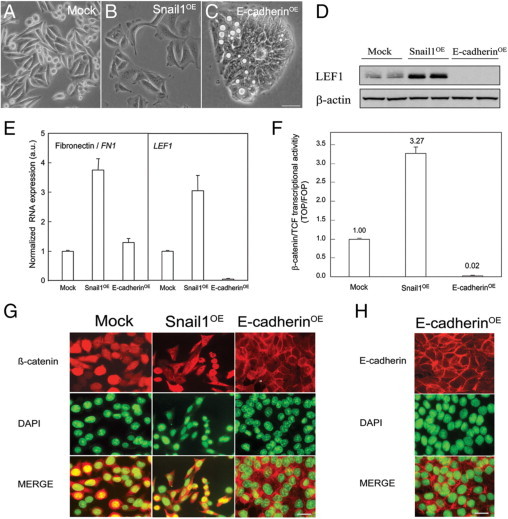
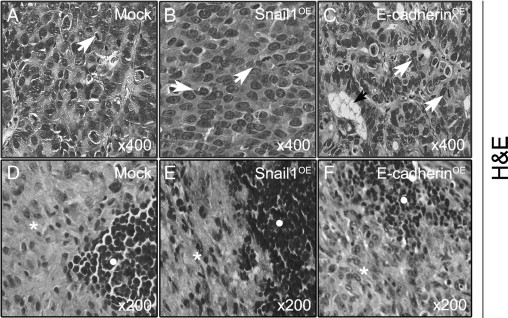
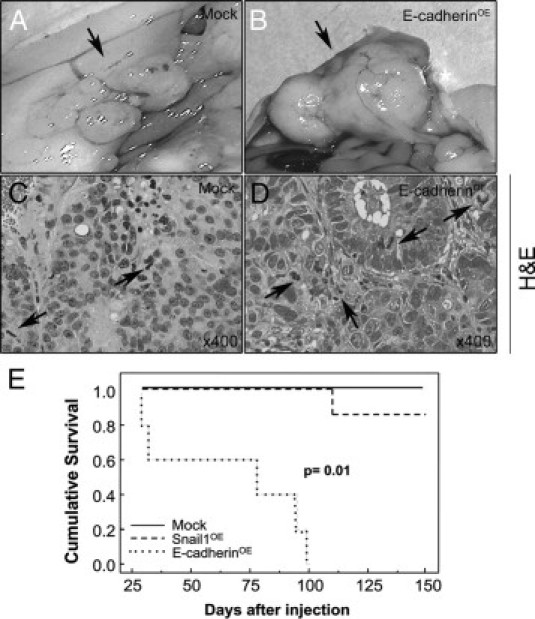
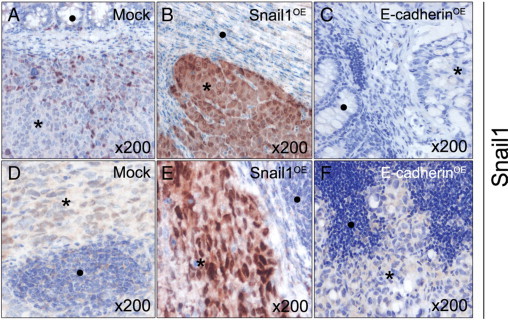
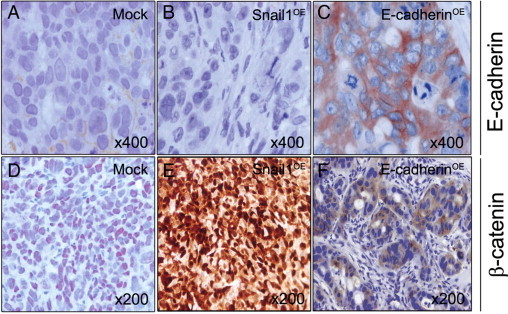
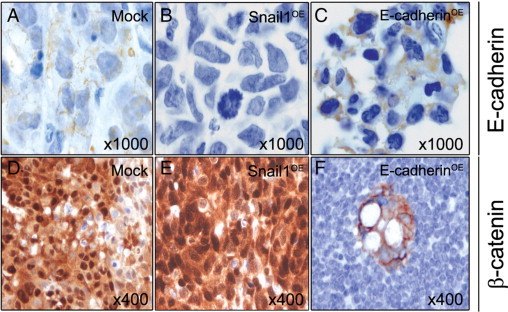
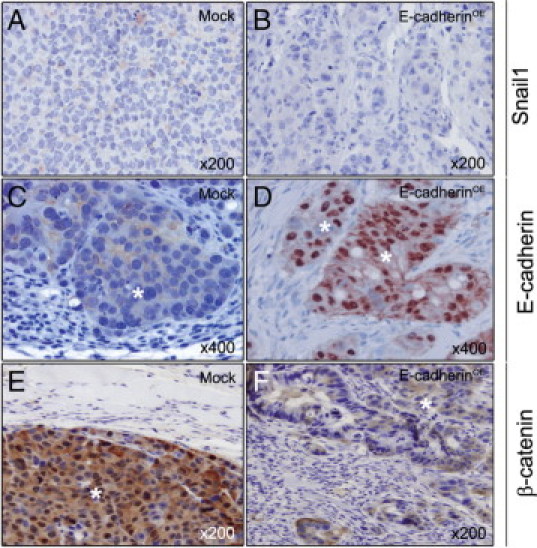
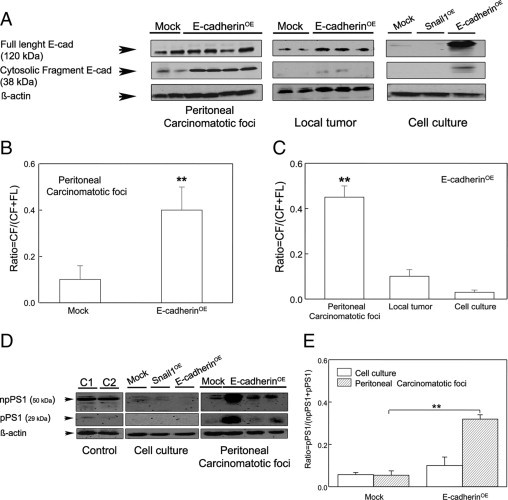
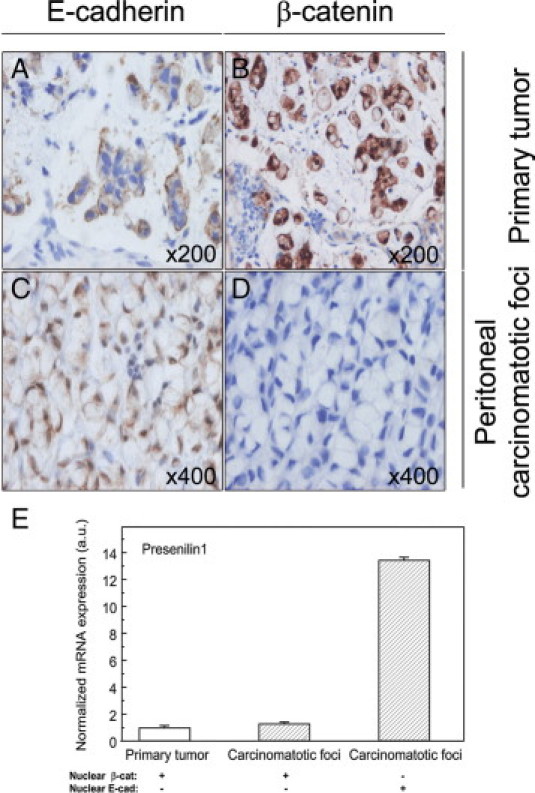
Metastases are frequently found during colorectal cancer diagnoses and are the main determinants of clinical outcome. The lack of reliable models of metastases has precluded their mechanistic understanding and our capacity to improve outcome. We studied the effect of E-cadherin and Snail1 expression on metastagenesis in a colorectal cancer model. We microinjected SW480-ADH human colorectal cancer cells, transfected with an empty vector (Mock) or overexpressing Snail1 (Snail1(OE)) or E-cadherin (E-cadherin(OE)), in the ceca of nude mice (eight per group) and analyzed tumor growth, dissemination, and Snail1, E-cadherin, β-catenin, and Presenilin1 (PS1) expression in local tumors and/or metastatic foci. Snail1(OE) cells disseminated only to lymph nodes, whereas Mock or E-cadherin(OE) cells spread to lymph nodes and peritoneums. Peritoneal tumor foci developed by E-cadherin(OE) cells presented an increase in E-cadherin proteolysis and nuclear translocation, and enhanced expression of proteolytically active PS1, which was linked to increased tumor growth and shortened mouse survival. Interestingly, local and lymph node tumors in mice bearing E-cadherin(OE) cells overexpressed E-cadherin, but they did not show E-cadherin proteolysis or nuclear translocation. Remarkably, E-cadherin nuclear translocation and enhanced expression of active PS1 were found in a patient with colorectal signet-ring cell carcinoma. In conclusion, we have established a colorectal cancer metastasis model in which E-cadherin proteolyis and nuclear translocation associates with aggressive foci growth only in the peritoneal microenvironment.


Figures

Figure 1
Figure 1
Characterization of cultured human SW480-ADH colorectal cancer cells stably expressing an empty vector (Mock cells) or overexpressing Snail1 (Snail1OE cells) or E-cadherin (E-cadherinOE). These cells were previously generated (22 and 25). A–C: Phase-contrast microscopy images of Mock (A), Snail1OE (B), and E-cadherinOE (C) SW480-ADH cells. Scale bar = 50 μm. Snail1OE cells displayed a large and stellate phenotype with few cell-cell contacts. E-cadherinOE cells displayed an epitheloid morphology with higher cell density and cell–cell contacts. Mock cells displayed a mixed phenotype with an intermediate cell density and a few suspended cells. D and E: The expression of the mesenchymal markers LEF1 and Fibronectin, as measured by Western blotting (D) or qRT-PCR (E), was higher in Snail1OE than in Mock or E-cadherinOE cells. E-cadherinOE cells showed a complete shut-down of LEF1 expression. F: β-catenin/TCF transcriptional activity was extremely reduced in E-cadherinOE cells compared with Mock or Snail1OE cells. G: β-catenin was nuclear (DAPI staining colocalization) in Mock and Snail1OE cells, whereas it was membranous and cytosolic in E-cadherinOE cells. Scale bar = 50 μm. H: E-cadherin was mostly membranous in E-cadherinOE cells. Scale bar = 50 μm.
Figure 2
Figure 2
Histopathology in local colonic tumors and lymph node foci derived from Mock, Snail1OE, and E-cadherinOE cells. Local tumors were poorly differentiated in the Mock group (A), undifferentiated in the Snail1OE group (B), and well-differentiated, containing glands and mucous deposits (black arrow) in the E-cadherinOE group (C). The mitotic rate (white arrows) was similar in all three groups. All lymph node tumor foci (white asterisk) infiltrated the lymph nodes, pushing aside normal lymphocytes (white circle). The lymph node tumor foci were poorly differentiated in the Mock group (D), undifferentiated in the Snail1OE group (E), and showed differentiation features in E-cadherinOE group (F).
Figure 3
Figure 3
Peritoneal carcinomatotic foci development and survival in mice implanted with Mock or E-cadherinOE cells. Tumor foci developed in the peritoneum (black arrow) after cecal implantation of Mock (A) or E-cadherinOE (B) cells, but not after implantation of Snail1OE cells. Tumor foci derived from E-cadherinOE cells were large (B) and well-differentiated and they had a high mitotic rate (D, black arrows). Tumor foci in the Mock group were small (A) and poorly differentiated, and they had a lower mitotic rate (C, black arrows). E: Cumulative survival was significantly higher in mice bearing tumors derived from Mock or from Snail1OE cells than in those bearing tumors derived from E-cadherinOE cells.
Figure 4
Figure 4
Snail1 expression in local colonic tumors and lymph node foci generated from Mock, Snail1OE, or E-cadherinOE cells. Snail1 immunostaining in both local tumor (A–C) and lymph node foci (D–F) were weak and nuclear in the Mock group (A and D), very strong and mostly nuclear in the Snail1OE group (B and E), and undetectable in the E-cadherin OE group (C and F). Black asterisk indicates tumor tissue; black circle indicates normal tissue.
Figure 5
Figure 5
E-cadherin and β-catenin expression in local colonic tumors derived from Mock, Snail1OE, and E-cadherinOE cells. E-cadherin immunostaining was weak and membranous in Mock group tumors (A), absent in Snail1OE group tumors (B), and intense, cytosolic, and membranous in tumors derived from E-cadherinOE cells (C). β-catenin immunostaining was moderately intense and nuclear in Mock group tumors (D), very intense and mostly nuclear in Snail1OE group tumors (E), and weak and cytosolic in E-cadherinOE group tumors (F). Hematoxylin costaining.
Figure 6
Figure 6
E-cadherin and β-catenin expression in lymph node foci derived from Mock, Snail1OE, or E-cadherinOE cells. E-cadherin immunostaining was weak and membranous in foci of the Mock group (A), undetectable in the Snail1OE group (B), and cytosolic and membranous in the E-cadherinOE group (C). β-catenin immunostaining was very strong and mostly nuclear in foci of the Mock (D) or Snail1OE (E) groups, and weak, cytosolic, and membranous in foci of the E-cadherinOE group (F). Hematoxylin costaining.
Figure 7
Figure 7
Snail1, E-cadherin, and β-catenin expression in peritoneal carcinomatotic foci of Mock and E-cadherinOE mice. Snail1 immunostaining was weak and cytosolic in Mock (A) and undetectable in E-cadherinOE (B) foci. E-cadherin immunostaining in peritoneal foci was weak and membranous in the Mock group (C) but very intense and mostly nuclear in the E-cadherinOE group (D). β-catenin immunostaining in carcinomatotic foci was very strong and mostly nuclear in the Mock group (E) but weak and cytosolic in the E-cadherinOE group (F). Hematoxylin costaining. White asterisks indicate tumor tissue.
Figure 8
Figure 8
Increased levels of proteolyzed E-cadherin and proteolytically active Presenilin1 (PS1) in peritoneal carcinomatotic foci developed from E-cadherinOE cells. Peritoneal foci in the E-cadherinOE group overexpressed E-cadherin and showed a significantly (P < 0.005) higher level of proteolyzed E-cadherin than peritoneal foci in the Mock group (A, left and B), than E-cadherinOE local colonic tumors (A, center and C) or E-cadherinOE cultured cells (A, right and C). Neither Mock nor Snail1 cultured cells showed E-cadherin proteolysis (A, right). PS1 was barely detectable in Mock, Snail1OE, and E-cadherinOE cells cultured in vitro (D). Moreover, peritoneal foci generated from E-cadherinOE cells showed a significantly (**P < 0.01) higher ratio of active PS1 than foci derived from Mock cells (D and E). Ratio of proteolyzed E-cadherin = CF/(FL + CF); CF = 38-kDa cytosolic E-cadherin fragment; FL = 120 kDa full-length E-cadherin. Ratio of proteolytically active PS1 = pPS1/(npPS1 + pPS1); npPS1 = non-processed inactive 50 kDa PS1; pPS1 = processed and proteolytically active 29 kDa PS1; Control C1 = CHO k1 p70 cells; C2 = PC12 cells; there is statistically significant differences between groups **P < 0.01.
Figure 9
Figure 9
Nuclear E-cadherin and Presenilin1 (PS1) expression in peritoneal foci of colorectal signet-ring cell carcinoma. Two patients were analyzed. In the primary tumor and the carcinomatotic foci of one patient, there were moderate levels of E-cadherin in the membrane (A), intense and mostly nuclear β-catenin expression levels (B), and low PS1 RNA levels (E, qRT-PCR). In the second patient, we observed the same pattern of E-cadherin and β-catenin expression in the primary tumor, but in contrast, the carcinomatotic foci showed intense nuclear E-cadherin immunostaining (C), a complete absence of β-catenin expression (D), and a 13-fold increase in PS1 RNA expression (E).

Similar articles

Cited by

References

    1. DeVita VT, Jr, Lawrence TS, Rosenberg SA. Cancer: Principles & Practice of Oncology. Eighth edition. Lippincott Williams & Wilkins; Philadelphia, PA: 2008. pp. 1144–1197.
    1. Guyot F, Faivre J, Manfredi S, Meny B, Bonithon-Kopp C, Bouvier AM. Time trends in the treatment and survival of recurrences from colorectal cancer. Ann Oncol. 2005;16:756–761. - PubMed
    1. Nelson WJ, Nusse R. Convergence of Wnt, beta-catenin, and cadherin pathways. Science. 2004;303:1483–1487. - PMC - PubMed
    1. Perl AK, Wilgenbus P, Dahl U, Semb H, Christofori G. A causal role for E-cadherin in the transition from adenoma to carcinoma. Nature. 1998;392:190–193. - PubMed
    1. Becker KF, Atkinson MJ, Reich U, Becker I, Nekarda H, Siewert JR, Höfler H. E-cadherin gene mutations provide clues to diffuse type gastric carcinomas. Cancer Res. 1994;54:3845–3852. - PubMed

Publication types

MeSH terms