Comparative Study
. 2010 Oct 29;107(9):1106-16.
doi: 10.1161/CIRCRESAHA.110.221069. Epub 2010 Sep 2.

Interleukin-17-dependent autoimmunity to collagen type V in atherosclerosis

Affiliations
Comparative Study

Interleukin-17-dependent autoimmunity to collagen type V in atherosclerosis

Melanie L Dart et al. Circ Res. .

Abstract

Rationale: Considerable evidence shows atherosclerosis to be a chronic inflammatory disease in which immunity to self-antigens contributes to disease progression. We recently identified the collagen type V [col(V)] α1(V) chain as a key autoantigen driving the Th17-dependent cellular immunity underlying another chronic inflammatory disease, obliterative bronchiolitis. Because specific induction of α1(V) chains has previously been reported in human atheromas, we postulated involvement of col(V) autoimmunity in atherosclerosis.

Objective: To determine whether col(V) autoimmunity may be involved in the pathogenesis of atherosclerosis.

Methods and results: Here, we demonstrate Th17-dependent anti-col(V) immunity to be characteristic of atherosclerosis in human coronary artery disease (CAD) patients and in apolipoprotein E-null (ApoE(-/-)) atherosclerotic mice. Responses were α1(V)-specific in CAD with variable Th1 pathway involvement. In early atherosclerosis in ApoE(-/-) mice, anti-col(V) immunity was tempered by an interleukin (IL)-10-dependent mechanism. In support of a causal role for col(V) autoimmunity in the pathogenesis of atherosclerosis, col(V) sensitization of ApoE(-/-) mice on a regular chow diet overcame IL-10-mediated inhibition of col(V) autoimmunity, leading to increased atherosclerotic burden in these mice and local accumulation of IL-17-producing cells, particularly in the col(V)-rich adventitia subjacent to the atheromas.

Conclusions: These findings establish col(V) as an autoantigen in human CAD and show col(V) autoimmunity to be a consistent feature in atherosclerosis in humans and mice. Furthermore, data are consistent with a causative role for col(V) in the pathogenesis of atherosclerosis.


Figures

Figure 1
Figure 1. Patients with coronary artery disease have an autoimmune response to col(V)
A, TV-DTH responses by PBMC from age-matched controls or end-stage CAD patients. Responses to EBV recall antigen (positive control), col(V), col(II), or col(I), shown as individual data points, were averaged from duplicate tests. Horizontal bars denote group means. The p value of comparison between CAD and control swelling responses to col(V) is shown. B, Dose-response in TV-DTH assay of PBMC from n=3 CAD patients and n=2 controls to col(V), or to separate α1(V) and α2(V) chains. C, TV-DTH responses to col(V) by whole PBMC, CD4 T cell-depleted PBMC, CD8 T cell-depleted, and CD14 monocyte depleted PBMC for n=4 CAD patients. Data points display mean and standard deviation for n=1-3 depletion experiments per patient. p value shown compares col(V) responses between CD4 T cell depletion or CD14 monocyte depleted and whole PBMC. D, CAD patients (n=3-5) whose TV-DTH responses to col(V) were > 75mm-3 were selected. PBMC were co-injected with col(V) and either IgG isotype control or neutralizing antibodies to IL-2, IL-4, IFN-γ, IL-17, IL-22 (n=4), IL-1β, or TNF-α. Horizontal bars represent the mean value for each group. Responses were compared with IgG isotype control injection. *p≤0.05; **p≤0.01, ***p≤0.0002.
Figure 2
Figure 2. ApoE−/− mice on a high fat diet have T and B cell autoimmunity to col(V)
ApoE−/− and B6 control mice were fed a high fat diet 15 weeks prior to experimentation. All mice were immunized with TT/DT 2 weeks prior to assay. A, TV-DTH measured T cell responses by splenocytes from ApoE−/− (n=9-21) or B6 control (n=15-21) mice. Responses are against TT/DT, col(V), col(II), col(I), and col(IV). Horizontal bars denote group means. Statistical significance is in comparison to the ApoE−/− col(V) swelling response. B, ApoE−/− mice with a swelling response > 50mm-3 to col(V) (n=7 mice) were selected for analysis. TV-DTH responses were compared between splenocytes injected with col(V) alone or in the presence of neutralizing antibodies to IFN-γ, IL-17, IL-1β, or TNF-α. Statistical significance is in comparison to swelling responses obtained with col(V) alone. C, Serum samples were analyzed for col(V)-specific antibodies (n=10 mice per group). Statistical significance in is comparision to antibody MFI obtained from ApoE−/− mice on a high fat diet. Horizontal bars represent the mean value for each group. *p≤0.05, **p≤0.005, and ***p≤0.0001.
Figure 3
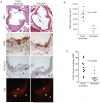
Figure 3. Col(V) is strongly expressed in advanced atherosclerotic plaques from ApoE−/− mice fed a high fat diet
A, C, E, F: ApoE−/− on a high fat diet. B, D: B6 control on a high fat diet. A & B, Representative cross sections of H&E stained aortic sinuses. C & D, Representative cross sections of Col (V) stained aortic arch sections. The hole within the plaque seen in C is a cholesterol cleft resulting from dissolving out of cholesterol crystals during paraffin processing. E, Representative cross section of CD68+ macrophage stained plaques in aortic sinus. F, Representative cross section of lipid staining using Oil Red O of a plaque in the aortic sinus (P=Plaque; M=Media). G, Quantitative analysis of total lesion area in aortic root sections. H, Quantitative analysis of percent vessel occlusion from plaque burden was performed on aortic roots. All samples collected from mice maintained on a high fat diet for 15 weeks. Each data point represents the mean value obtained from 3 serial aortic sinus sections for each mouse; horizontal bars represent the mean value for each group. Mann-Whitney p value is shown.
Figure 4
Figure 4. ApoE−/− mice on a regular chow diet have an IL-10 regulated autoimmune response to col (V)
ApoE−/− mice were fed either a high fat diet or fed a regular chow diet for 15 weeks prior to collection of splenocytes for the TV-DTH assay. A) TV-DTH responses to col(V) (ApoE−/− high fat n=27; ApoE regular chow n=14) and col(I) (ApoE−/− high fat n=9; ApoE regular chow n=14). B)ApoE−/− mice fed a regular chow diet were immunized to TT/DT two weeks prior to splenocyte collection. TV-DTH responses to recall TT/DT, col(V) or col(I) alone, or col(V) or col(I) in the presence of neutralizing antibodies to TGF-b or IL-10. n=14 for assays done with col(V), n=3-9 for assays done with col(I). Data shown as mean +/− standard deviation.
Figure 5
Figure 5. Sensitization to col(V) results in exacerbated atherosclerotic disease
ApoE−/− mice were i.v. treated with 8 doses of 50 μg col(V) at biweekly intervals or were left untreated; all were fed regular chow for 15 weeks. A, Representative H&E stained (40×), CD68 macrophage stained (200X), lipid stained (Oil Red O - 200X), and complement C3d stained (200X) aortic root sections. P-plaque, M-media, and A-adventitia. B, Quantitative analysis of total plaque area was performed on aortic roots taken at age 22 weeks. Each data point represents the mean value of total lesion area from 3 serial aortic sinus sections (n=10 mice per group). C, Serum samples were analyzed for col(V)-specific antibodies (n=10 in each group). Horizontal bars represent mean value for each group. Mann-Whitney p value for comparison is shown.
Figure 6
Figure 6. Sensitization to col(V) results in exacerbated atherosclerotic disease
ApoE−/− mice were i.v. treated with 8 doses of 50 μg col(V) at biweekly intervals or were left untreated; all were fed regular chow for 15 weeks. A, CD3 T cell staining from aortic root sections. Top panels - 100X view of plaque area and associated adventia. Center panels - plaque area at 400X. Bottom panels – underlying adventitia area at 400X. P-plaque, M-media, and A-adventitia. B, Number of infiltrating CD3+ T cells in the adventitial area underlying the plaque (left panel) and in the plaque itself (right panel) calculated from serial aortic root sections (n=5). Horizontal bars represent mean value for each group. Mann-Whitney p value for comparison is shown.
Figure 7
Figure 7. IL-17-producing macrophages and T cells can be found in atherosclerotic plaques and adventitia of col(V)-sensitized ApoE−/− mice
Representative immunofluorescent staining of plaques in aortic root sections from col(V) i.v. treated ApoE−/− mice maintained on a regular chow. Left panels were stained for CD68+ macrophages (green), DAPI for nuclei (blue), and IL-17 (red). Right panels were stained for CD3+ T cells (green) DAPI for nuclei (blue), and IL-17 (red). P=plaque; M=media; and A=adventitia.

References

    1. Sherer Y, Shoenfeld Y. Mechanisms of disease: atherosclerosis in autoimmune diseases. Nat Clin Pract Rheumatol. 2006;2:99–106. - PubMed
    1. Hansson GK. Inflammation, atherosclerosis, and coronary artery disease. N Engl J Med. 2005;352:1685–1695. - PubMed
    1. Murray CJ, Lopez AD. Global mortality, disability, and the contribution of risk factors: Global Burden of Disease Study. Lancet. 1997;349:1436–1442. - PubMed
    1. Sigal LH. Basic science for the clinician 44: atherosclerosis: an immunologically mediated (autoimmune?) disease. J Clin Rheumatol. 2007;13:160–168. - PubMed
    1. Blasi C. The autoimmune origin of atherosclerosis. Atherosclerosis. 2008 - PubMed

Publication types

MeSH terms