. 2010 Aug 15;9(16):3256-76.
doi: 10.4161/cc.9.16.12553. Epub 2010 Aug 28.

Oxidative stress in cancer associated fibroblasts drives tumor-stroma co-evolution: A new paradigm for understanding tumor metabolism, the field effect and genomic instability in cancer cells

Affiliations

Oxidative stress in cancer associated fibroblasts drives tumor-stroma co-evolution: A new paradigm for understanding tumor metabolism, the field effect and genomic instability in cancer cells

Ubaldo E Martinez-Outschoorn et al. Cell Cycle. .

Abstract

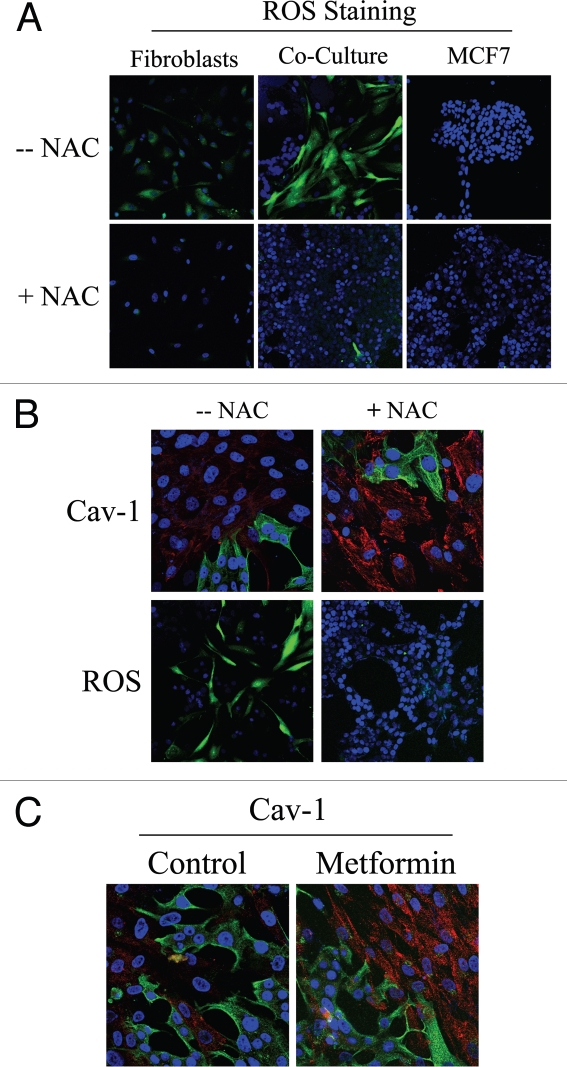
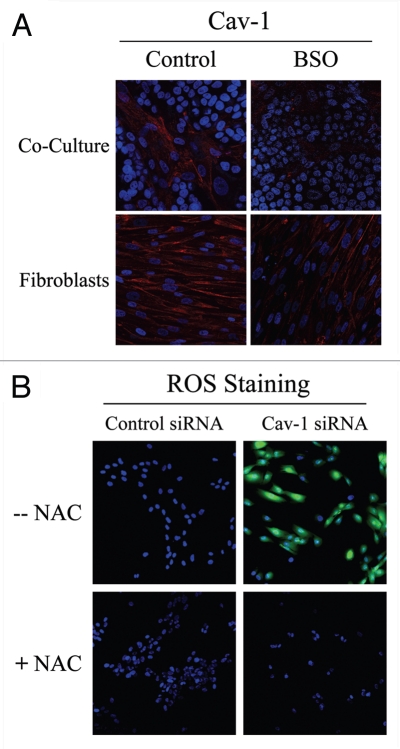
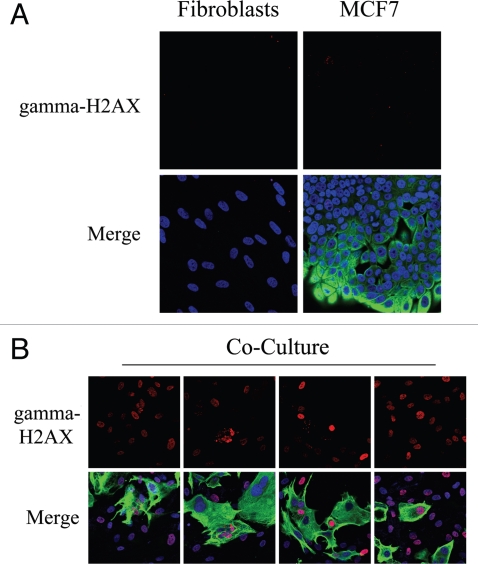
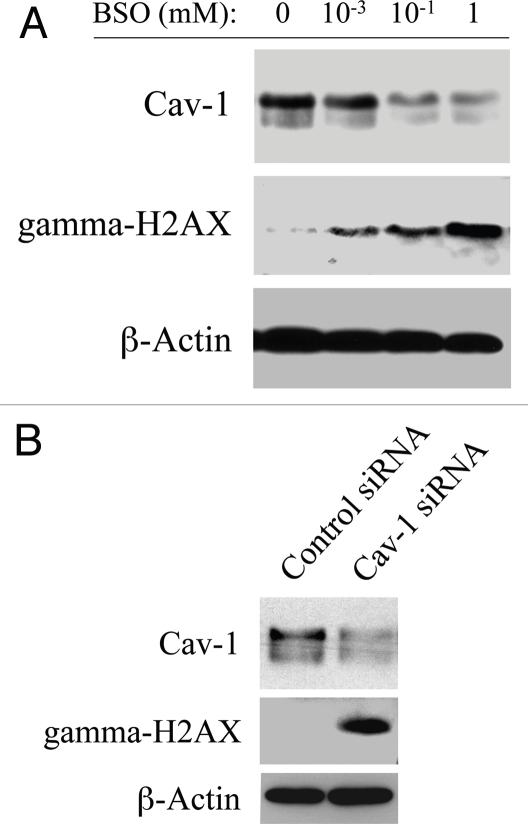
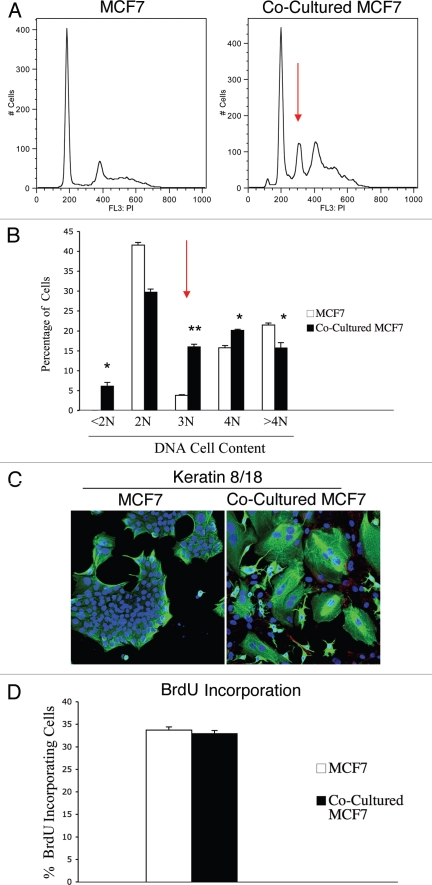
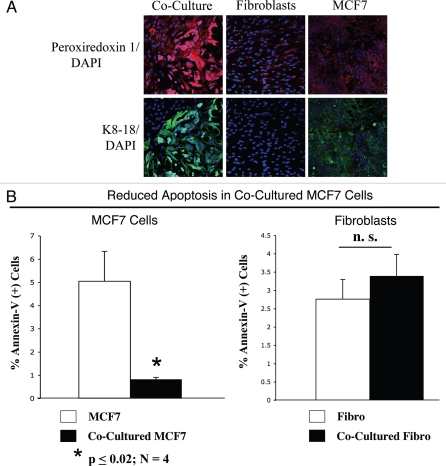
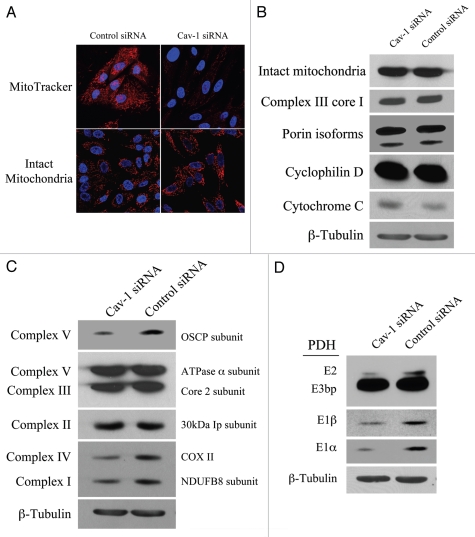
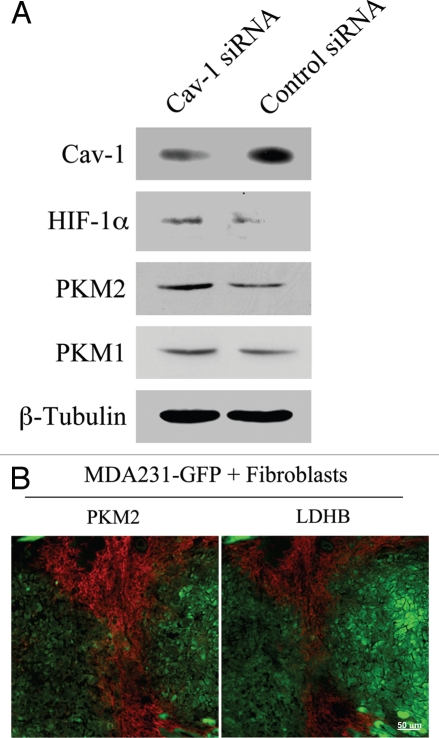
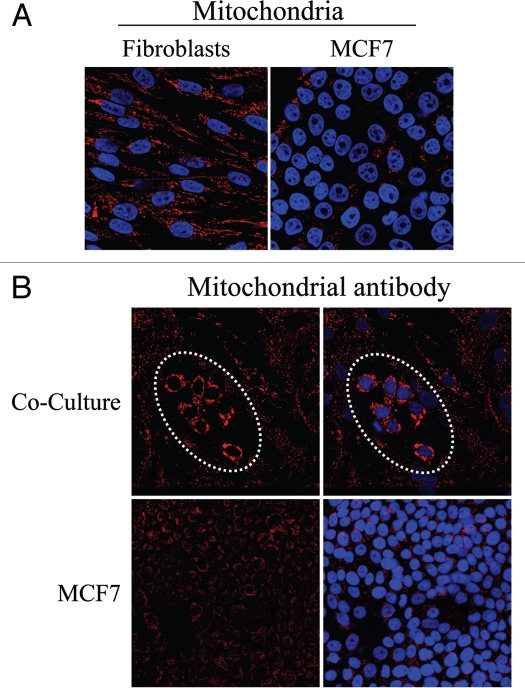
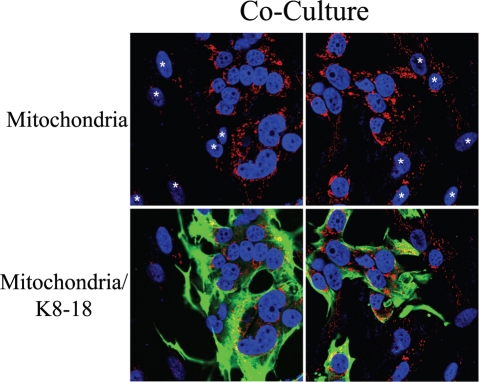
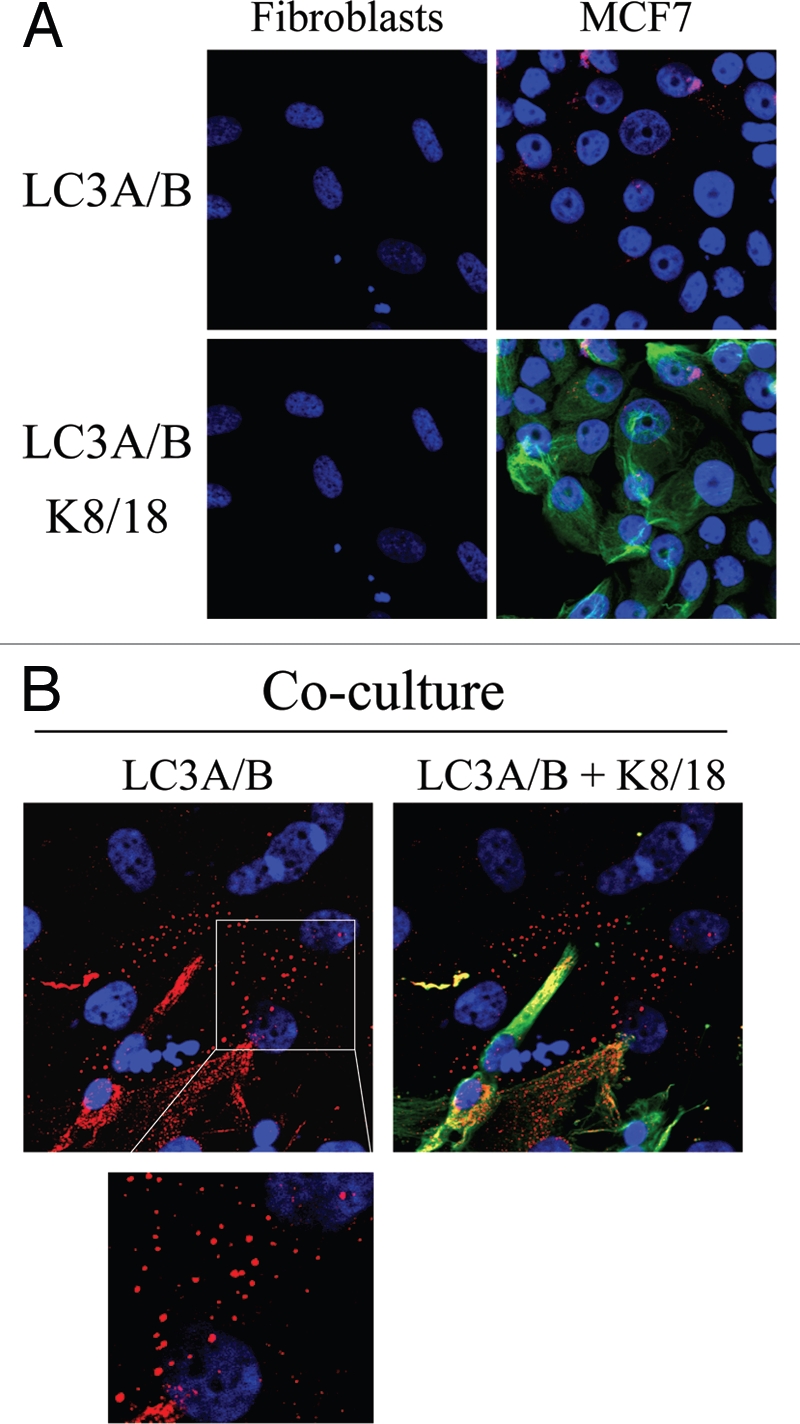
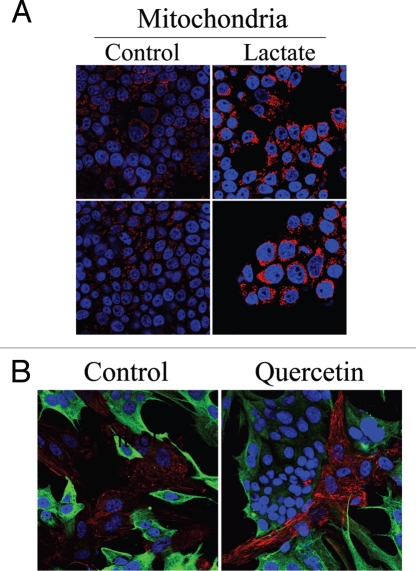
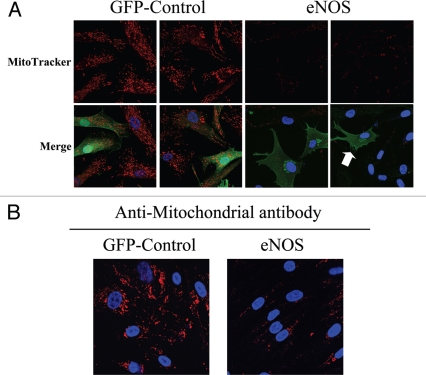
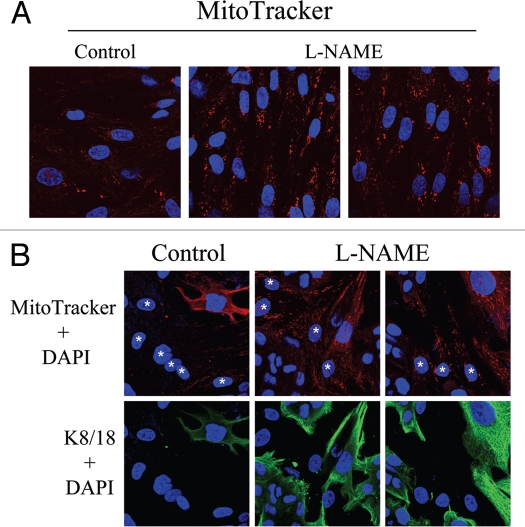
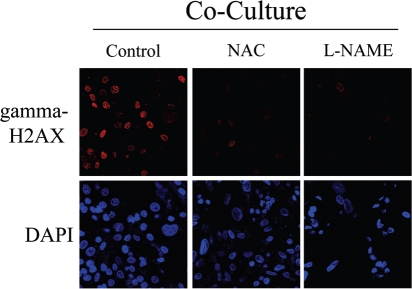
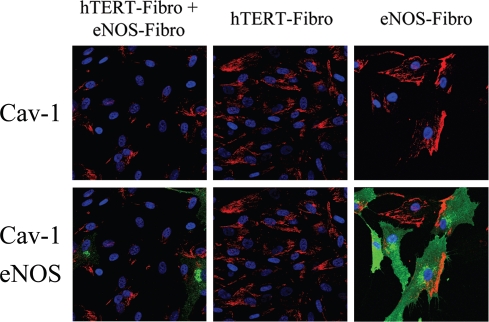
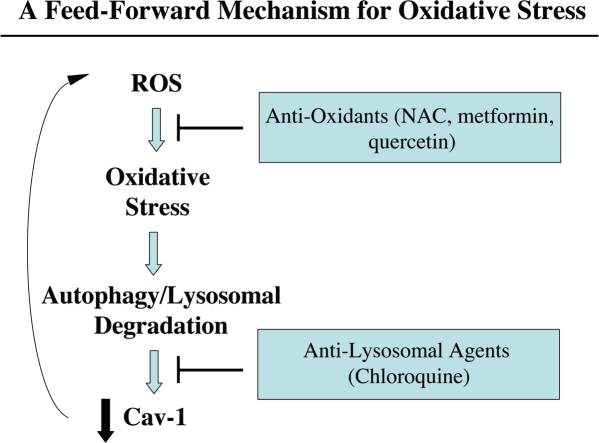
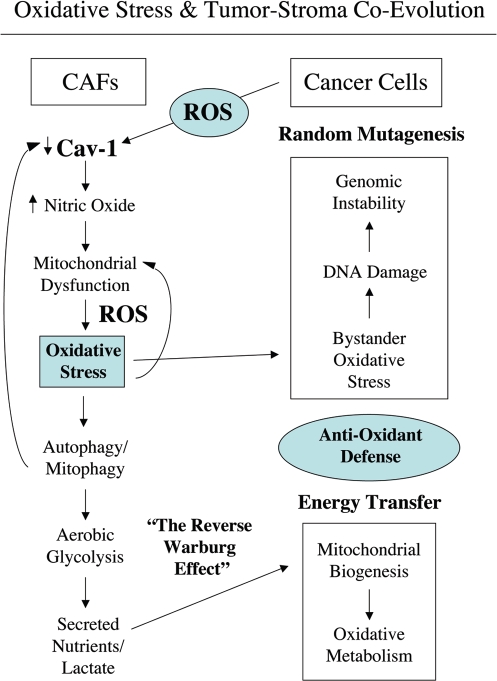
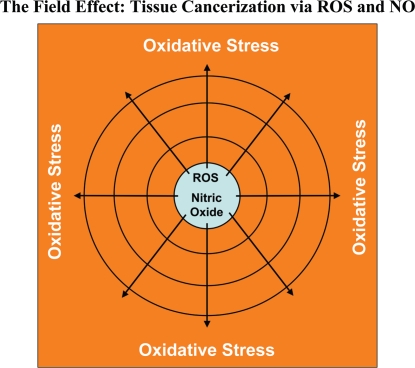
Loss of stromal fibroblast caveolin-1 (Cav-1) is a powerful single independent predictor of poor prognosis in human breast cancer patients, and is associated with early tumor recurrence, lymph node metastasis and tamoxifen-resistance. We developed a novel co-culture system to understand the mechanism(s) by which a loss of stromal fibroblast Cav-1 induces a "lethal tumor micro-environment." Here, we propose a new paradigm to explain the powerful prognostic value of stromal Cav-1. In this model, cancer cells induce oxidative stress in cancer-associated fibroblasts, which then acts as a "metabolic" and "mutagenic" motor to drive tumor-stroma co-evolution, DNA damage and aneuploidy in cancer cells. More specifically, we show that an acute loss of Cav-1 expression leads to mitochondrial dysfunction, oxidative stress and aerobic glycolysis in cancer associated fibroblasts. Also, we propose that defective mitochondria are removed from cancer-associated fibroblasts by autophagy/mitophagy that is induced by oxidative stress. As a consequence, cancer associated fibroblasts provide nutrients (such as lactate) to stimulate mitochondrial biogenesis and oxidative metabolism in adjacent cancer cells (the "Reverse Warburg Effect"). We provide evidence that oxidative stress in cancer-associated fibroblasts is sufficient to induce genomic instability in adjacent cancer cells, via a bystander effect, potentially increasing their aggressive behavior. Finally, we directly demonstrate that nitric oxide (NO) over-production, secondary to Cav-1 loss, is the root cause for mitochondrial dysfunction in cancer associated fibroblasts. In support of this notion, treatment with anti-oxidants (such as N-acetyl-cysteine, metformin and quercetin) or NO inhibitors (L-NAME) was sufficient to reverse many of the cancer-associated fibroblast phenotypes that we describe. Thus, cancer cells use "oxidative stress" in adjacent fibroblasts (i) as an "engine" to fuel their own survival via the stromal production of nutrients and (ii) to drive their own mutagenic evolution towards a more aggressive phenotype, by promoting genomic instability. We also present evidence that the "field effect" in cancer biology could also be related to the stromal production of ROS and NO species. eNOS-expressing fibroblasts have the ability to downregulate Cav-1 and induce mitochondrial dysfunction in adjacent fibroblasts that do not express eNOS. As such, the effects of stromal oxidative stress can be laterally propagated, amplified and are effectively "contagious"--spread from cell-to-cell like a virus--creating an "oncogenic/mutagenic" field promoting widespread DNA damage.


Figures

Figure 1
Figure 1
Cancer cells induce ROS production in fibroblasts, driving stromal Cav-1 downregulation: Rescue with anti-oxidants. (A) ROS are elevated in fibroblasts co-cultured with MCF7 cells. To detect ROS generation, CM-H2DCFDA staining (green) was performed on hTERT-fibroblasts co-cultured with MCF7 cells. Also, mono-cultures of hTERT-fibroblasts and MCF7 cells were stained in parallel. Cells were counterstained with Hoechst nuclear stain (blue). Samples were then immediately imaged using a 488 nm excitation wavelength. As a critical control, in a parallel set of experiments, cells were pre-incubated with the ROS scavenger NAC. Note that ROS are generated mainly in co-cultured fibroblasts (upper middle panel) and NAC treatment completely abrogates ROS production. Minimal amounts of ROS were detected in singly cultured cells. Importantly, images were acquired using identical exposure settings. Original magnification, 20x. (B) Treatment with the ROS scavenger NAC restores Cav-1 expression in co-cultured fibroblasts. Day 5 fibroblast-MCF7 co-cultures were incubated with the ROS scavenger NAC (10 mM, right panels) or with vehicle alone (left panels). Upper panels. Co-cultures were fixed and immunostained with anti-Cav-1 (red) and anti-K8/18 (green, detecting tumor epithelial cells) antibodies. DAPI was used to stain nuclei (blue). Note that Cav-1 levels are decreased in fibroblasts in co-culture (left upper panel) and the ROS scavenger NAC blocks the Cav-1 downregulation (right upper panel). Lower panels. In a parallel experiment, CM-H2DCFDA (green) was used to detect ROS generation. Cells were stained with Hoechst nuclear stain (blue). Importantly, images were acquired using identical exposure settings. Original magnification, 40x for upper panels, 20x for lower panels. (C) Treatment with the antioxidant metformin upregulates Cav-1 in co-cultured fibroblasts. Day 5 hTERT-fibroblast-MCF7 cell co-cultures were incubated with metformin or with vehicle alone (control). Co-cultures were fixed and immunostained with anti-Cav-1 (red) and anti-K8/18 (green) antibodies. DAPI was used to stain nuclei (blue). Note that metformin blocks the Cav-1 downregulation that normally occurs in fibroblasts in co-culture. Importantly, images were acquired using identical exposure settings. Original magnification, 40x.
Figure 2
Figure 2
Glutathione depletion is sufficient to induce Cav-1 downregulation and Cav-1 knock-down induces ROS production: A feed-forward mechanism for oxidative stress. (A) treatment with the glutathione synthase inhibitor BSO downregulates Cav-1 in fibroblasts. Fibroblast-MCF7 co-cultures and hTERT-fibroblast homotypic cultures were incubated with vehicle alone (control) or with the glutathione synthaset inhibitor BSO (1 µM), which generates ROS via glutathione depletion. Cells were fixed and immuno-stained with anti-Cav-1 (red) antibodies. DAPI was used to stain nuclei (blue). Note that BSO treatment decreases Cav-1 levels in co-cultured fibroblasts and homotypic cultures. Importantly, images were acquired using identical exposure settings. original magnification, 40x. (B) Cav-1 knock-down induces ROS production. CM-H2DCFDA staining (green) was performed on hTERT-fibroblasts treated with Cav-1 siRNA (right) or control siRNA (left). Cells were counterstained with Hoechst nuclear stain (blue). Samples were then immediately imaged using a 488 nm excitation wavelength. As a critical control, cells were pre-incubated with the ROS scavenger NAC in parallel. Note that Cav-1 knock-down greatly promotes ROS generation. As expected, NAC blocks ROS accumulation. Importantly, images were acquired using identical exposure settings. Original magnification, 20x.
Figure 3
Figure 3
Fibroblast-MCF7 co-cultures show increased DNA damage, as evidenced by DNA double strand break foci. (A and B) Increased gamma-H2AX staining in co-cultured fibroblasts. To detect DNA double strand breaks, co-cultures of hteRt-fibroblasts and MCF7 cells and corresponding homotypic cultures were immunostained with anti-gamma-H2AX (red) and anti-K8/18 (green, detecting tumor epithelial cells) antibodies. DAPI was used to stain nuclei (blue). Importantly, images were acquired using identical exposure settings. Upper panels show only the red channel to appreciate gamma-H2AX staining, while the lower panels show the merged images. (A) Gamma-H2AX is undetectable in mono-cultures of fibroblasts and MCF7 cells. (B) High levels of DNA double strand breaks are detected in most co-cultured fibroblasts and in many MCF7 cells. Original magnification, 40x.
Figure 4
Figure 4
Loss of Cav-1 and oxidative stress both induce DNA damage in fibroblasts. (A) BSO promotes Cav-1 downregulation and DNA double strand breaks. To induce oxidative stress, hTERT-fibroblasts were grown in 10% NuSerum and treated with increasing concentrations of the glutathione synthase inhibitor BSO or with vehicle alone (H2O) for 24–48 hours. Then, cells were subjected to western blot analysis with antibodies against Cav-1 and gamma-H2AX. β-actin was used as an equal loading control, and remained unchanged after 24 and 48 hours of BSO treatment. Note that BSO treatment downregulates Cav-1 expression levels and promotes DNA double strand breaks in a concentration-dependent fashion. Consistent with the idea that Cav-1 has a very long half-life, Cav-1 downregulation is detected only after 48 hours of BSO treatment. Conversely, gamma-H2AX levels are increased already after 24 hours of BSO treatment. (B) Cav-1 knock-down promotes DNA double strand breaks. hTERT-fibroblasts treated with Cav-1 siRNA or control siRNA were subjected to Western blot analysis using antibodies against Cav-1 and gamma-H2AX. β-actin was used as an equal loading control. Note that siRNA-mediated Cav-1 downregulation is sufficient to greatly induce DNA double strand breaks.
Figure 5
Figure 5
Fibroblasts induce aneuploidy in co-cultured MCF7 cells. (A and B) DNA cell content analysis. GFp (+) MCF7 cells were plated in mono-culture or in co-culture with hteRt-fibroblasts. the day after, media was changed to DMEM with 10% NuSerum and cells were grown for 48 hours. then, to isolate the GFP (+) MCF7 cell population from the fibroblasts, co-cultured cells were FACS-sorted using a 488 nm laser. As a critical control, mono-cultures of GFP (+) MCF7 cells were sorted in parallel. Then, sorted cells were fixed and stained with PI. DNA cell content was analyzed by flow cytometry. (A) Representative traces. Note that co-culture with fibroblasts induces the appearance of a large aneuploid peak (cells with an abnormal DNA content of ∼3N) in MCF7 cells (red arrow). In addition, a larger population of cells with DNA content of 4N is detected in co-cultured MCF7 cells compared to MCF7 cell mono-cultures. (B) Cell numbers with a given DNA cell content were determined and graphed as a percentage of the total population. *p < 0.01, **p < 0.0000003. (C) Immunofluorescence. MCF7 cells were grown in mono-culture or in co-culture with hTERT-fibroblasts for 5 days. Then, cells were fixed and immunostained with antibodies directed against Cav-1 (red, labeling fibroblasts) and K8/18 (green, labeling MCF7 cells). Nuclei were counterstained with DAPI (blue). Note that many MCF7 cells in co-culture are multinucleated, suggesting that in co-culture a sub-population of MCF7 cells undergo nuclear, but not cellular division. Note also that Cav-1 expression is very low in co-cultured fibroblasts, as expected. original magnification, 20x. (D) BrdU incorporation. To evaluate proliferation, GFP (+) MCF7 cells were grown in co-culture with hTERT-fibroblasts or in mono-culture for 48 hours. Then, cells were pulsed-labeled with BrdU for one hour, sorted to purify the GFP (+) cells and fixed overnight. BrdU incorporation was analyzed by flow cytometry. Co-culture with fibroblasts does not affect proliferation of MCF7 cells. Columns, relative BrdU incorporation from at least three independent experiments; bars, SEM.
Figure 6
Figure 6
MCF7 cancer cells mount an anti-oxidant defense when co-cultured with fibroblasts, protecting them from apoptosis. (A) Increased expression of peroxiredoxin-1 in co-cultured MCF7 cells. Day 5 co-cultures of hTERT-fibroblasts and MCF7 cells and the corresponding homotypic cultures were immunostained with anti-peroxiredoxin-1 (red) and anti-K8/18 (green, detecting tumor epithelial cells) antibodies. DAPI was used to stain nuclei (blue). Upper panels show only the red channel to appreciate peroxiredoxin 1 staining, while the lower panels show the merged images. Note that the expression level of peroxiredoxin-1 is very low in homotypic cultures of fibroblasts and MCF7 cells. However, peroxiredoxin-1 levels are greatly increased in co-cultured MCF7 cells. Importantly, images were acquired using identical exposure settings. Original magnification, 20x. (B) Reduced apoptosis in MCF7 co-cultures. Co-cultures of hTERT-fibroblasts and GFP (+) MCF7 cells and the corresponding homotypic cultures were subjected to annexin-V staining and then analyzed by FACS. Thus, the GFP (+) and GFP (−) cells represent MCF7 cells and hTERT-fibroblasts, respectively. Note that MCF7 cells maintained in co-culture show an ∼6-fold reduction in apoptosis, as compared to MCF7 cells cultured alone. Although co-cultured fibroblasts do not show a significant change in apoptosis rates, there still must be a high level of protection, as the co-cultured fibroblasts show the largest increases in ROS production and DNA damage, without any increases in apoptosis.
Figure 7
Figure 7
Loss of Cav-1 induces mitochondrial dysfunction in fibroblasts. (A) Cav-1 knock-down decreases mitochondrial activity. hTERT-fibroblasts were treated with Cav-1 siRNA (right) or control siRNA (left). Then, functional mitochondria with active membrane potential were visualized using MitoTracker staining (red, upper panels). In parallel, to visualize mitochondrial mass, cells were fixed and immunostained with an anti-intact mitochondrial membrane antibody (Red, lower panels). DAPI was used to stain nuclei (blue). Note that transient Cav-1 knock-down greatly decreases mitochondrial activity, without affecting mitochondrial biogenesis. Importantly, paired images were acquired using identical exposure settings. original magnification, 63x. (B) Cav-1 knock-down does not affect mitochondrial structural integrity. hTERT-fibroblasts treated with Cav-1 siRNA or control siRNA were subjected to Western blot analysis using a panel of antibodies evaluating the mitochondrial membrane integrity. This panel includes antibodies against the surface of intact mitochondria, the inner mitochondrial membrane (complex III Core1), the outer mitochondrial membrane protein (porin isoforms), the matrix space (cyclophilin D) and the intermembrane space (cytochrome C). β-tubulin was used as an equal loading control. Note that Cav-1 knock-down does not affect the status of the mitochondrial membrane integrity. (C) Cav-1 knock-down impairs oxidative phosphorylation in fibroblasts. The oxidative phosphorylation (OXPHOS) profile was evaluated by Western blot analysis on hTERT-fibroblasts treated with Cav-1 siRNA or control siRNA. The OXPHOS panel includes antibodies against the subunits of complexes (I–V) that are labile when the respective complex is improperly assembled. β-tubulin was used as an equal loading control. Note that the levels of the subunits of complex I, IV and V are decreased in Cav-1 knock-down cells. (D) Cav-1 knock-down downregulates PDH subunits in fibroblasts. hTERT-fibroblasts treated with Cav-1 siRNA or control siRNA were analyzed by Western blot using antibodies against PDH subunits. β-tubulin was used as an equal loading control. Note that Cav-1 knock-down decreases the expression of three PDH subunits (E1α, E1β and E2).
Figure 8
Figure 8
Cancer associated fibroblasts undergo a glycolytic switch in vitro and in vivo. (A) Cav-1 knock-down induces increased expression of glycolysis regulators in fibroblasts. hTERT-fibroblasts treated with Cav-1 siRNA or control siRNA were subjected to Western blot analysis with antibodies against HIF-1α, PKM2 and PKM1. Note that Cav-1 knock-down increases the expression of HIF-1α and PKM2, two master regulators of aerobic glycolysis in tumors. No significant differences in PKM1 levels were detected. β-tubulin was used as an equal loading control. (B) PKM2 and LDHB are expressed in the stroma of MDA-MB-231 cell xenografts. hTERT-fibroblasts and the highly aggressive human breast cancer cell line (MDA-MB-231) were co-injected in nude mice. After 2 weeks, xenograft tumors were harvested and analyzed by immunohistochemistry using PKM2 and LDHB antibodies (red). The MDA-MB-231 tumor cells were GFp (+) (green) and were detected by autofluorescence. Note that the two glycolytic enzymes PKM2 and LDHB are preferentially expressed in the tumor stroma. Consecutive frozen sections were stained in parallel
Figure 9
Figure 9
Fibroblasts induce increased mitochondrial mass in co-cultured MCF7 cells: Evidence that the conventional Warburg effect is an artifact. (A) In mono-cultures, mitochondria mass is lower in MCF7 cells as compared to fibroblasts. Homotypic cultures of MCF7 cells and hTERT-fibroblasts were immunostained with antibodies against an anti-intact mitochondrial membrane antibody (red). DAPI was used to stain nuclei (blue). Note that the mitochondrial mass is lower in mono-cultures of MCF7 cells, as compared to fibroblasts. Importantly, images were acquired using identical exposure settings. Original magnification, 40x. (B) Fibroblasts increase mitochondrial mass in co-cultured MCF7 cells. Co-cultures of hTERT-fibroblasts and MCF7 cells were fixed and immunostained with anti-intact inner mitochondrial membrane (red) antibody. DAPI was used to stain nuclei (blue). Note that co-culture with fibroblasts induces a significant increase in mitochondrial mass in the “central MCF7 cell colony”, encircled by a white dotted oval. Importantly, images were acquired using identical exposure settings. Original magnification, 20x.
Figure 10
Figure 10
Fibroblasts induce increased mitochondrial mass in co-cultured MCF7 cells: Double-labeling with keratin shows co-segregation with mitochondrial mass. Mitochondrial mass is low in fibroblasts and elevated in MCF7 cells in co-culture. Co-cultures of hTERT-fibroblasts and MCF7 cells were fixed and immunostained with anti-intact inner mitochondrial membrane (red) and anti-K8/18 (green) antibodies. DAPI was used to stain nuclei (blue). Note that in co-culture the mitochondrial mass is low in fibroblasts but elevated in MCF7 cells. Stars denote fibroblast nuclei. Importantly, images were acquired using identical exposure settings used in Figure 9. original magnification, 63x.
Figure 11
Figure 11
Possible role of stromal autophagy in decreasing mitochondrial mass in co-cultured fibroblasts. (A and B). hTERT-fibroblast-MCF7 cell co-cultures and corresponding mono-cultures were fixed and immunostained with anti-LC3 (red) and anti-K8/18 (green) antibodies. DAPI was used to stain nuclei (blue). (A) None or very little LC3A/B staining is detected in homotypic cultures of fibroblasts and MCF7 cells. (B) Note that LC3 is localized to autophagocytic vesicles in co-cultured fibroblasts, suggesting that mitochondrial loss could be mediated by autophagy. Original magnification, 63x.
Figure 12
Figure 12
Lactate treatment promotes mitochondrial biogenesis in MCF7 cells. (A) Lactate administration increases the mitochondrial mass of MCF7 cells. Homotypic cultures of MCF7 cells were treated with 10 mM L-lactate or vehicle alone (H2O) for 48 hours. Cells were fixed and immunostained with an anti-intact mitochondrial membrane antibody (red). DAPI was used to stain nuclei (blue). Note that lactate treatment increases mitochondrial mass in MCF7 cells, thus simulating the co-culture with fibroblasts. Importantly, images were acquired using identical exposure settings. Original magnification, 63x. (B) Quercetin increases Cav-1 expression in fibroblasts in co-cultures. hTERT-fibroblast-MCF7 cell co-cultures were incubated with 10 mM quercetin—an MCT inhibitor or vehicle alone (DMSO) control for 5 days. Cells were fixed and immunostained with anti-Cav-1 (red) and anti-K8/18 (green) antibodies. DAPI was used to stain nuclei (blue). Note that upon quercetin treatment, Cav-1 levels are increased in fibroblasts. Importantly, images were acquired using identical exposure settings. Original magnification, 40x.
Figure 13
Figure 13
Nitric oxide production induces mitochondrial dysfunction in fibroblasts. (A) eNOS recombinant overexpression decreases mitochondrial activity and phenocopies loss of Cav-1. hTERT-fibroblasts transiently expressing eNOS or the GFP-control were incubated with MitoTracker (red). eNOS (green) was visualized using an eNOS antibody while GFP-controls (green) were visualized using autofluorescence. DAPI was used to stain nuclei (blue). Note that mitochondrial activity is undetectable in eNOS expressing cells, and even in eNoS negative cells that are adjacent to eNOS positive cells. This is consistent with the idea that NO is a diffusible metabolite which mediates a “field effect” (see the white arrow, pointing at a single eNOS positive cell, surrounded by 8 eNOS negative fibroblasts). GFP-control cells display high levels of mitochondrial staining, as expected. Importantly, images were acquired using identical exposure settings. Original magnification, 63x. (B) eNOS recombinant overexpression decreases mitochondrial mass. hTERT-fibroblasts stably overexpressing eNoS also show dramatic reductions in mitochondrial mass, as compared with control fibroblasts stably expressing GFP. Cells were fixed and immunostained with an anti-intact mitochondrial membrane antibody (red). DAPI was used to stain nuclei (blue). Original magnification, 63x.
Figure 14
Figure 14
Rescue of mitochondrial dysfunction with L-NAME, an inhibitor of NO production. (A) L-NAME increases mitochondrial activity. hTERT-fibroblasts were treated for 24 hours with 20 mM L-NAME or vehicle alone (H2O) before incubation with MitoTracker (red). DAPI was used to stain nuclei (blue). Note that L-NAME treatment greatly increases mitochondrial activity. Original magnification, 63x. (B) L-NAME abrogates the mitochondrial phenotypes in co-cultured cells. hTERT-fibroblast-MCF7 cell co-cultures were incubated with 20 mM L-NAME or vehicle alone (H2O) control for 24 hours. Then, cells were incubated with MitoTracker (red), fixed and immunostained with anti-K/18 (green) antibodies. DAPI was used to stain nuclei (blue). Note that upon L-NAME treatment, mitochondrial activity is increased in fibroblasts and decreased in MCF7 cells. Stars denote fibroblast nuclei. Upper panels show only the red channel to appreciate the MitoTracker staining, while the lower panels show the merged images of K8/18 and DAPI. Importantly, images were acquired using identical exposure settings. Original magnification, 40x.
Figure 15
Figure 15
Rescue of DNA damage in fibroblast-MCF7 co-cultures with NAC and L-NAME. Treatment with NAC and L-NAME abolishes DNA double strand breaks in co-culture. Day2 co-cultures of hTERT-fibroblasts and MCF7 cells were treated with 10 mM NAC or with 20 mM L-NAME or with vehicle alone (H2O) for 72 hours. Then, cells were immunostained with anti-gamma-H2AX (red) antibodies. DAPI was used to stain nuclei (blue). Upper panels show only the red channel to appreciate gamma-H2AX staining, while the lower panels show nuclei staining. High levels of DNA double strand breaks are detected in co-cultured cells. Note that treatment with NAC and L-NAME abolishes DNA double strand breaks in co-cultured cells. Importantly, images were acquired using identical exposure settings. Original magnification, 40x.
Figure 16
Figure 16
Paracrine NO production downregulates Cav-1 in adjacent normal fibroblasts: Evidence for a field effect. NO-overproduction downregulates Cav-1 expression. hTERT-fibroblasts stably expressing eNOS (eNOS-fibro) were co-cultured with control hTERT-fibroblasts for 5 days. Homotypic cultures of both types of fibroblasts were also established in parallel. Then, cells were immunostained with anti-Cav-1 (red) and eNOS (green) antibodies. DAPI was used to stain nuclei (blue). Upper panels show only the red channel to appreciate Cav-1 staining, while the lower panels show the merged images. Note that co-culture of eNOS-fibroblasts and hTERT-fibroblasts (originally plated in a 1:1 cell ratio) greatly downregulates Cav-1 expression in all cells, suggesting a “field effect” secondary to NO over-production. Importantly, images were acquired using identical exposure settings. Original magnification, 40x.
Figure 17
Figure 17
Cav-1 downregulation provides a “feed-forward” mechanism for oxidative stress. Here, we show that epithelial cancer cells (MCF7) have the ability to induce ROS production in adjacent normal fibroblasts (Fig. 1A). This may be due to the production of ROS species in epithelial cancer cells, which are then transferred to fibroblasts, initiating a cascade of oxidative stress in fibroblasts. In support of this notion, epithelial cancer cells need to be in direct contact with fibroblasts to mediate Cav-1 downregulation. For example, conditioned media from MCF7 epithelial cancer cells is not sufficient to downregulate Cav-1 in fibroblasts. Oxidative stress, in turn, induces the onset of autophagy and the production of auto-phagosomes that fuse with lysosomes, leading to the degradation of intracellular organelles, such as caveolae and mitochondria. This would promote a loss of Cav-1 expression, which we have shown is sufficient to drive additional ROS production (Fig. 2B). In support of this model, we have previously demonstrated that chloroquine blocks the stromal loss of Cav-1 expression in fibroblast/MCF7 co-cultures. Similalry, treatment with anti-oxidants (such as NAC, metformin and quercetin) also blocks the stromal loss of Cav-1 expression in fibroblast/MCF7 co-cultures (see Figs. 1B, C and 12B). Thus, the proposed model explains how both anti-oxidants and anti-lysosomal agents prevent the loss of Cav-1 in our co-culture studies.
Figure 18
Figure 18
Oxidative stress in cancer associated fibroblasts functions as a “metabolic” and “mutagenic” motor, driving epithelial cancer cell evolution. An oxidative stress based model of tumor-stroma co-evolution is presented, which summarizes our current findings. In this model, the mutagenic evolution and metabolic coupling of cancer cells with adjacent fibroblasts during tumor formation is highlighted. First, cancer cells induce a loss of Cav-1 in adjacent fibroblasts. Loss of Cav-1 triggers NO production, mitochondrial dysfunction and oxidative stress in fibroblasts—via ROS production. In turn, oxidative stress affects both cancer cells and fibroblasts. In cancer cells, oxidative stress promotes DNA damage and genetic instability, by a bystander effect. Thus, cancer cells induce oxidative stress in fibroblasts, which sequentially leads to their own mutagenesis, promoting a more aggressive phenotype (mutagenic evolution). On the other hand, oxidative stress triggers autophagy/mitophagy and aerobic glycolysis in CAFs, with HIF-1α upregulation, inducing the creation of a lactate-rich microenvironment. In this way, CAFs provide nutrients to cancer cells, to stimulate their mitochondrial biogenesis, and directly fuel oxidative metabolism (metabolic coupling). In addition, cancer cells escape oxidative mitochondrial damage and apoptosis by the upregulation of anti-oxidant enzymes, such us peroxiredoxin-1. Oxidative stress-induced autophagy may play a key role in mediating both Cav-1 downregulation and in the disposal of damaged mitochondria, promoting aerobic glycolysis in cancer-associated fibroblasts (the Reverse Warburg effect). For example, treatment with an autophagy inhibitor (namely chloroquine) blocks the downregulation of Cav-1 observed upon co-culture with MCF7 cells, suggesting that Cav-1 and caveolae both undergo autophagic-lysomal degradation in fibroblasts.
Figure 19
Figure 19
Oxidative stress drives tissue cancerization: The field effect. In the field effect, it is believed that both the malignant tumor cells and the surrounding or adjacent normal area have undergone a mysterious “cancerization” process to allow for the development of multiple independent foci of tumor growth in a given area. Both genetic and epigenetic alterations have been invoked to explain the field effect, but it still remains an enigma. Here, we suggest that the field effect could be mediated and propagated by oxidative (ROS) and nitrative (NO) stress in cancer associated fibroblasts. First, we envision that cancer cells could induce oxidative stress in adjacent fibroblasts. Then, oxidative stress in the adjacent fibroblasts could be laterally propagated from cell-to-cell like a virus, resulting in the amplification of oxidative stress in a given tissue area or field. This would then provide a “mutagenic/oxidative field” resulting in widespread ROS production and DNA damage. In support of these ideas, here we show that bystander oxidative stress is sufficient to induce DNA damage and aneuploidy in co-cultured MCF7 cells. Furthermore, we demonstrate that eNOS-expressing fibroblasts (undergoing oxidative and nitrative stress) have the ability to induce the downregulation of Cav-1 in adjacent normal fibroblasts, when they are co-cultured together. Thus, oxidative and/or nitrative stress in cancer associated fibroblasts provides a new paradigm by which we can understand how “field cancerization” occurs, and how it can be passed from cell-to-cell in a “contagious” fashion, essentially propagated as “waves of oncogenic stress”.

References

    1. Koleske AJ, Baltimore D, Lisanti MP. Reduction of caveolin and caveolae in oncogenically transformed cells. Proc Natl Acad Sci USA. 1995;92:1381–1385. - PMC - PubMed
    1. Lee SW, Reimer CL, Oh P, Campbell DB, Schnitzer JE. Tumor cell growth inhibition by caveolin reexpression in human breast cancer cells. Oncogene. 1998;16:1391–1397. - PubMed
    1. Park DS, Razani B, Lasorella A, Schreiber-Agus N, Pestell RG, Iavarone A, et al. Evidence that Myc isoforms transcriptionally repress caveolin-1 gene expression via an INR-dependent mechanism. Biochemistry. 2001;40:3354–3362. - PubMed
    1. Galbiati F, Volonte D, Engelman JA, Watanabe G, Burk R, Pestell RG, et al. Targeted downregulation of caveolin-1 is sufficient to drive cell transformation and hyperactivate the p42/44 MAP kinase cascade. EMBO J. 1998;17:6633–6648. - PMC - PubMed
    1. Liu J, Lee P, Galbiati F, Kitsis RN, Lisanti MP. Caveolin-1 expression sensitizes fibroblastic and epithelial cells to apoptotic stimulation. Am J Physiol Cell Physiol. 2001;280:823–835. - PubMed

Publication types

MeSH terms