

A mechanistic model of PCR for accurate quantification of quantitative PCR data
- PMID: 20814578
- PMCID: PMC2930010
- DOI: 10.1371/journal.pone.0012355
A mechanistic model of PCR for accurate quantification of quantitative PCR data
Abstract
Background: Quantitative PCR (qPCR) is a workhorse laboratory technique for measuring the concentration of a target DNA sequence with high accuracy over a wide dynamic range. The gold standard method for estimating DNA concentrations via qPCR is quantification cycle () standard curve quantification, which requires the time- and labor-intensive construction of a standard curve. In theory, the shape of a qPCR data curve can be used to directly quantify DNA concentration by fitting a model to data; however, current empirical model-based quantification methods are not as reliable as standard curve quantification.
Principal findings: We have developed a two-parameter mass action kinetic model of PCR (MAK2) that can be fitted to qPCR data in order to quantify target concentration from a single qPCR assay. To compare the accuracy of MAK2-fitting to other qPCR quantification methods, we have applied quantification methods to qPCR dilution series data generated in three independent laboratories using different target sequences. Quantification accuracy was assessed by analyzing the reliability of concentration predictions for targets at known concentrations. Our results indicate that quantification by MAK2-fitting is as reliable as standard curve quantification for a variety of DNA targets and a wide range of concentrations.
Significance: We anticipate that MAK2 quantification will have a profound effect on the way qPCR experiments are designed and analyzed. In particular, MAK2 enables accurate quantification of portable qPCR assays with limited sample throughput, where construction of a standard curve is impractical.
Conflict of interest statement
Figures
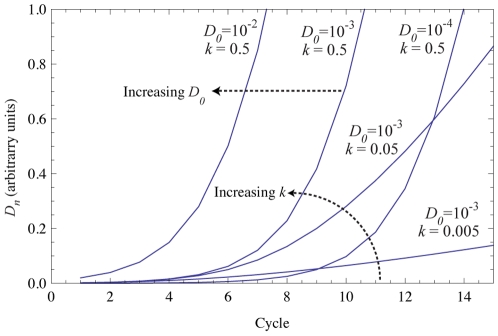
 shifts the MAK2 curve to the left, while increasing
  increases the slope of the MAK2 curve.
 :
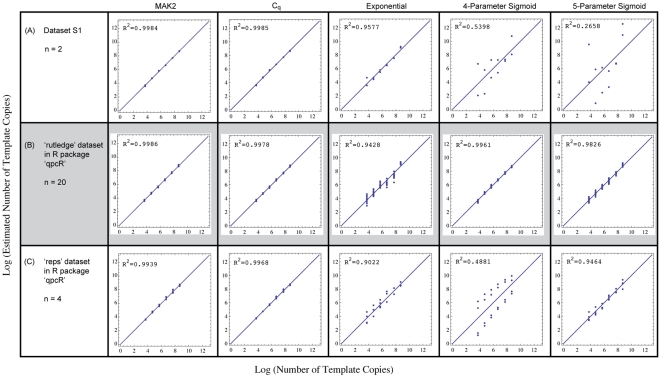
:  standard curve calibration; Exponential: exponential curve-fitting ; 4-Parameter Sigmoid: sigmoidal curve-fitting (SCF) with a 4-parameter log-logistic function ; 5-Parameter Sigmoid: SCF with a 5-parameter log-logistic function . Each dataset is from a different target sequence diluted sequentially by ten-fold to obtain data from a concentration range of six orders of magnitude. Panels in the figure contain log-log plots of estimated vs. actual number of template molecules. The line at 45
 in each plot represents the line of agreement between prediction and known amount. Rows are labeled with the source of the data. Dataset S1, from experiments performed by the authors, is published online.
References
-
- Lagally ET, Mathies RA. Integrated genetic analysis microsystems. Journal of Physics D-Applied Physics. 2004;37:R245–R261.
-
- Higuchi R, Fockler C, Dollinger G, Watson R. Kinetic PCR Analysis: Real-time Monitoring of DNA Amplification Reactions. Bio-Technology. 1993;11:1026–1030. - PubMed
-
- Liu WH, Saint DA. A new quantitative method of real time reverse transcription polymerase chain reaction assay based on simulation of polymerase chain reaction kinetics. Analytical Biochemistry. 2002;302:52–59. - PubMed
-
- Liu WH, Saint DA. Validation of a quantitative method for real time pcr kinetics. Biochemical and Biophysical Research Communications. 2002;294:347–353. - PubMed
Publication types
MeSH terms
Substances
Grants and funding
LinkOut - more resources
Full Text Sources
Other Literature Sources
Molecular Biology Databases
