

Aberrant expression of LMO4 induces centrosome amplification and mitotic spindle abnormalities in breast cancer cells
- PMID: 20814902
- PMCID: PMC3600378
- DOI: 10.1002/path.2762
Aberrant expression of LMO4 induces centrosome amplification and mitotic spindle abnormalities in breast cancer cells
Abstract
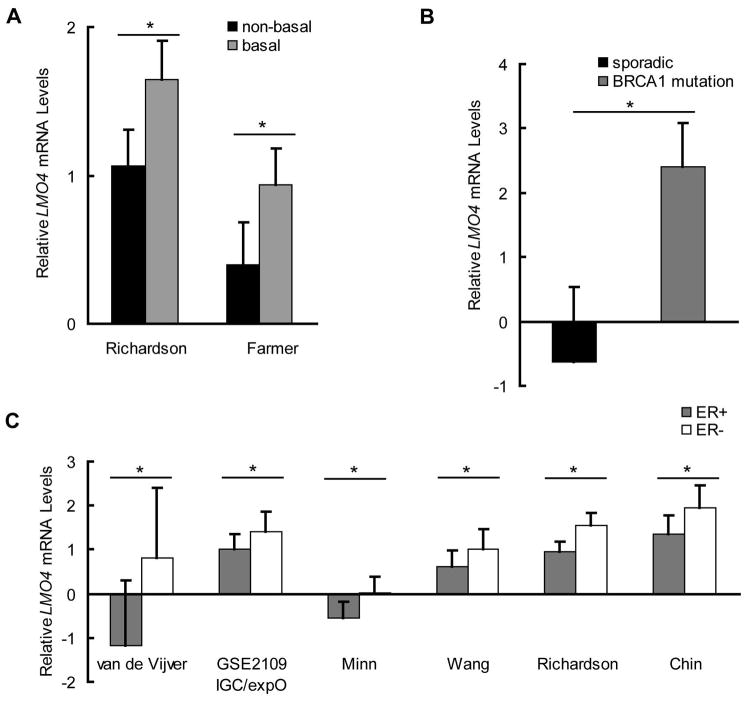
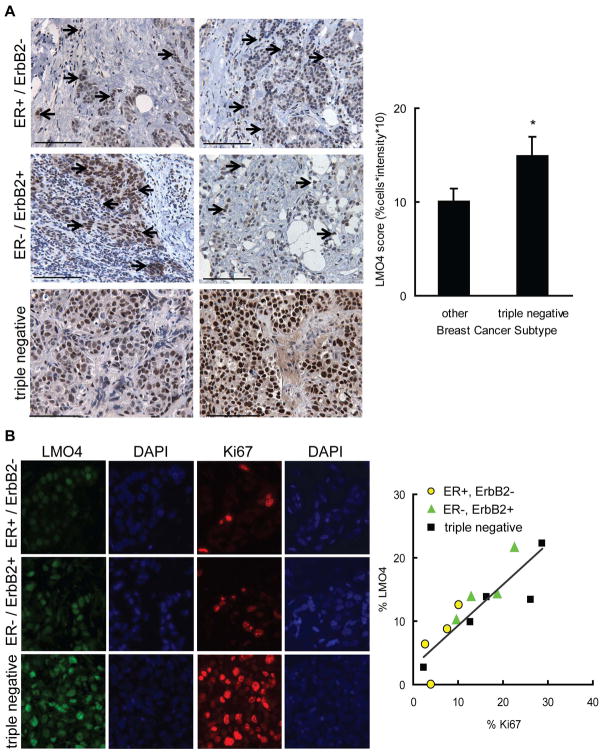
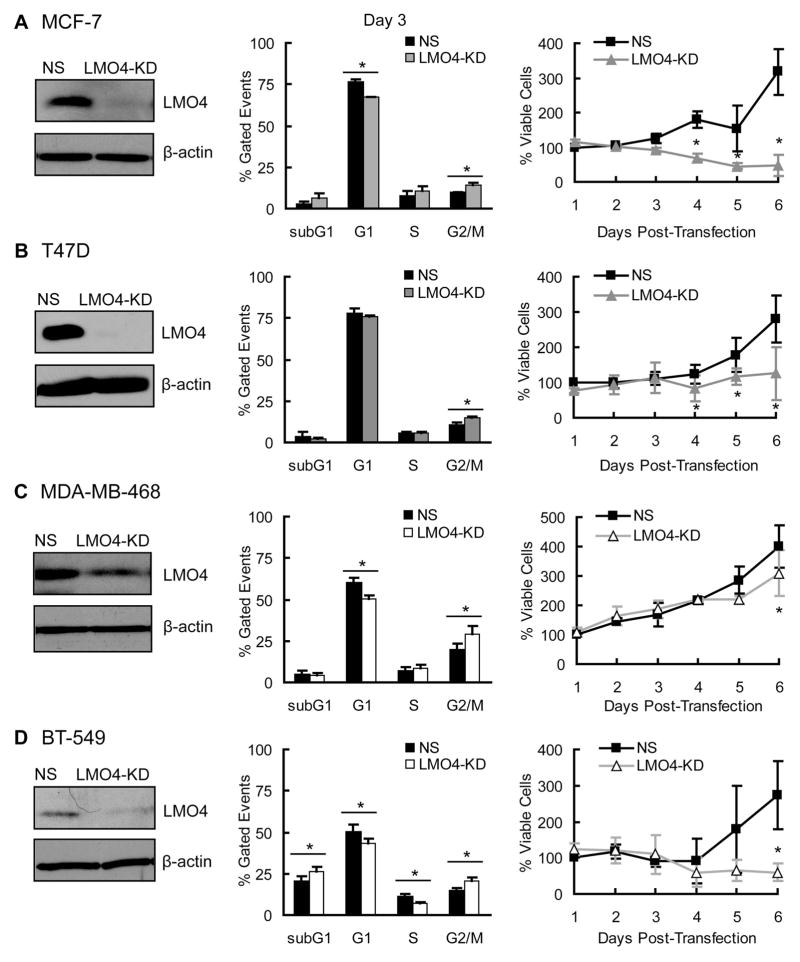
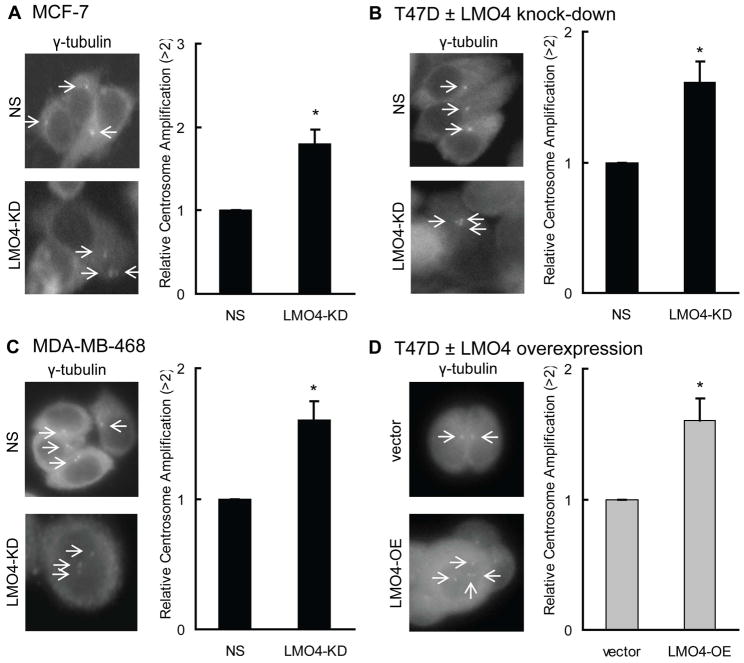
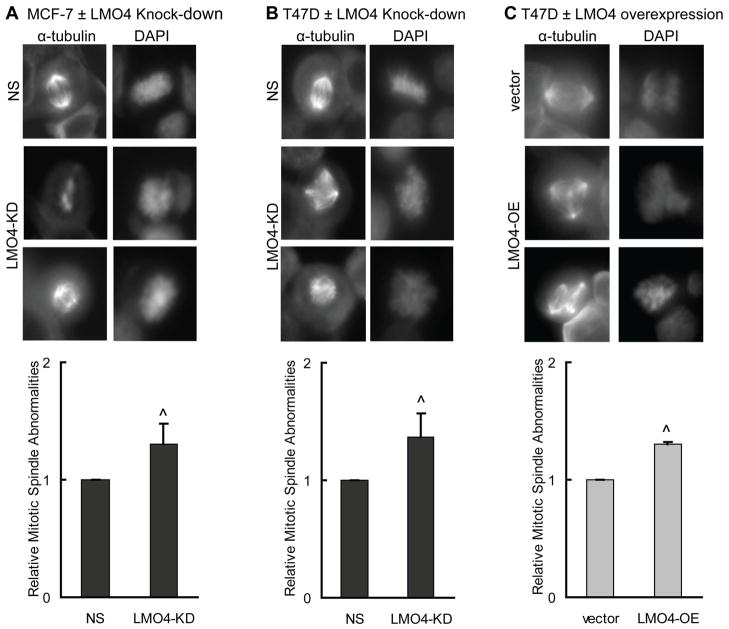
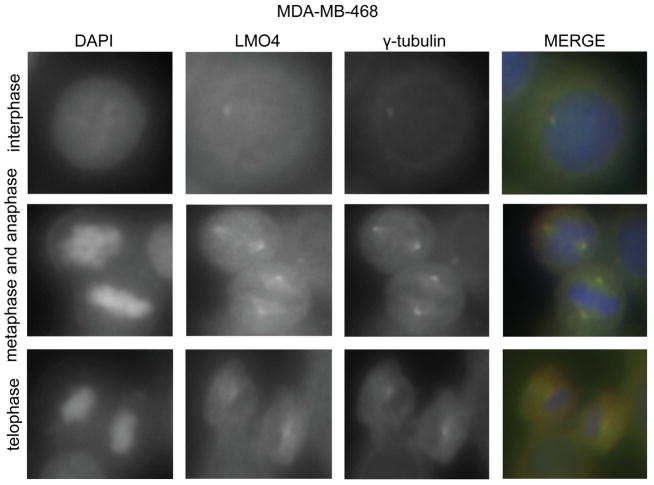
The LIM-only protein, LMO4, is a transcriptional modulator overexpressed in breast cancer. It is oncogenic in murine mammary epithelium and is required for G2/M progression of ErbB2-dependent cells as well as growth and invasion of other breast cancer cell types. However, the mechanisms underlying the oncogenic activity of LMO4 remain unclear. Herein, we show that LMO4 is expressed in all breast cancer subtypes examined and its expression level correlates with the degree of proliferation of such tumours. In addition, we have determined that LMO4 silencing induces G2/M arrest in cells from various breast cancer subtypes, suggesting that LMO4 action in the cell cycle is not restricted to a single breast cancer subtype. This arrest was accompanied by increased cell death, amplification of centrosomes, and formation of abnormal mitotic spindles. Consistent with its ability to positively and negatively regulate the formation of active transcription complexes, overexpression of LMO4 also resulted in an increase in centrosome number. Centrosome amplification has been shown to prolong the G2/M phase of the cell cycle and induce apoptosis; thus, we conclude that supernumerary centrosomes mediate the G2/M arrest and cell death in LMO4-deficient cells. Furthermore, the correlation of centrosome amplification with genomic instability suggests that the impact of dysregulated LMO4 on the centrosome cycle may promote LMO4-induced tumour formation.
Copyright © 2010 Pathological Society of Great Britain and Ireland. Published by John Wiley & Sons, Ltd.
Conflict of interest statement
Conflicts of Interest: No conflicts of interest were declared.
Figures
Similar articles
-
LMO4 is an essential mediator of ErbB2/HER2/Neu-induced breast cancer cell cycle progression.Oncogene. 2009 Oct 15;28(41):3608-18. doi: 10.1038/onc.2009.221. Epub 2009 Aug 3. Oncogene. 2009. PMID: 19648968 Free PMC article.
-
The LIM domain gene LMO4 inhibits differentiation of mammary epithelial cells in vitro and is overexpressed in breast cancer.Proc Natl Acad Sci U S A. 2001 Dec 4;98(25):14452-7. doi: 10.1073/pnas.251547698. Proc Natl Acad Sci U S A. 2001. PMID: 11734645 Free PMC article.
-
Negative regulation of estrogen receptor alpha transactivation functions by LIM domain only 4 protein.Cancer Res. 2005 Nov 15;65(22):10594-601. doi: 10.1158/0008-5472.CAN-05-2268. Cancer Res. 2005. PMID: 16288053
-
Mitotic spindle multipolarity without centrosome amplification.Nat Cell Biol. 2014 May;16(5):386-94. doi: 10.1038/ncb2958. Nat Cell Biol. 2014. PMID: 24914434 Review.
-
Dysregulation of the centrosome induced by BRCA1 deficiency contributes to tissue-specific carcinogenesis.Cancer Sci. 2021 May;112(5):1679-1687. doi: 10.1111/cas.14859. Epub 2021 Mar 16. Cancer Sci. 2021. PMID: 33606355 Free PMC article. Review.
Cited by
-
LIM-domain-only proteins: multifunctional nuclear transcription coregulators that interacts with diverse proteins.Mol Biol Rep. 2014 Feb;41(2):1067-73. doi: 10.1007/s11033-013-2952-1. Epub 2013 Dec 31. Mol Biol Rep. 2014. PMID: 24379077 Review.
-
Contribution of DEAF1 structural domains to the interaction with the breast cancer oncogene LMO4.PLoS One. 2012;7(6):e39218. doi: 10.1371/journal.pone.0039218. Epub 2012 Jun 19. PLoS One. 2012. PMID: 22723967 Free PMC article.
-
The oncoprotein HBXIP activates transcriptional coregulatory protein LMO4 via Sp1 to promote proliferation of breast cancer cells.Carcinogenesis. 2013 Apr;34(4):927-35. doi: 10.1093/carcin/bgs399. Epub 2013 Jan 5. Carcinogenesis. 2013. PMID: 23291272 Free PMC article.
-
Prognostic value of CA20, a score based on centrosome amplification-associated genes, in breast tumors.Sci Rep. 2017 Mar 21;7(1):262. doi: 10.1038/s41598-017-00363-w. Sci Rep. 2017. PMID: 28325915 Free PMC article.
-
LMO4 mediates trastuzumab resistance in HER2 positive breast cancer cells.Am J Cancer Res. 2018 Apr 1;8(4):594-609. eCollection 2018. Am J Cancer Res. 2018. PMID: 29736306 Free PMC article.
References
-
- Mousses S, Bubendorf L, Wagner U, Hostetter G, Kononen J, Cornelison R, et al. Clinical validation of candidate genes associated with prostate cancer progression in the CWR22 model system using tissue microarrays. Cancer Res. 2002;62:1256–1260. - PubMed
-
- Wang N, Kudryavtseva E, Ch’en IL, McCormick J, Sugihara TM, Ruiz R, et al. Expression of an engrailed-LMO4 fusion protein in mammary epithelial cells inhibits mammary gland development in mice. Oncogene. 2004;23:1507–1513. - PubMed
Publication types
MeSH terms
Substances
Grants and funding
LinkOut - more resources
Full Text Sources
Medical
Research Materials
Miscellaneous
