Comparative Study
. 2010 Sep;32(3):654-62.
doi: 10.1002/jmri.22258.

Post-processing correction of the endorectal coil reception effects in MR spectroscopic imaging of the prostate

Affiliations
Comparative Study

Post-processing correction of the endorectal coil reception effects in MR spectroscopic imaging of the prostate

Susan M Noworolski et al. J Magn Reson Imaging. 2010 Sep.

Abstract

Purpose: To develop and validate a post-processing correction algorithm to remove the effect of the inhomogeneous reception profile of the endorectal coil on MR spectroscopic imaging (MRSI) data.

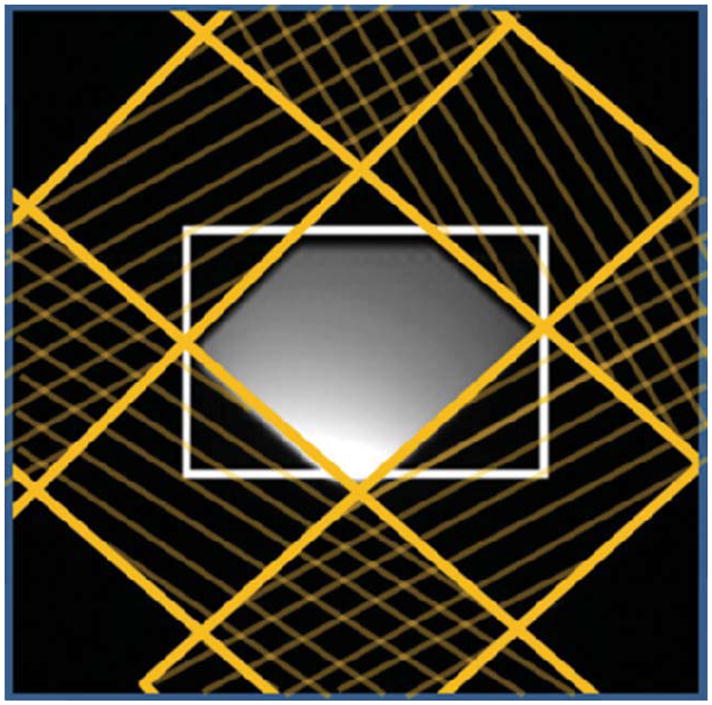
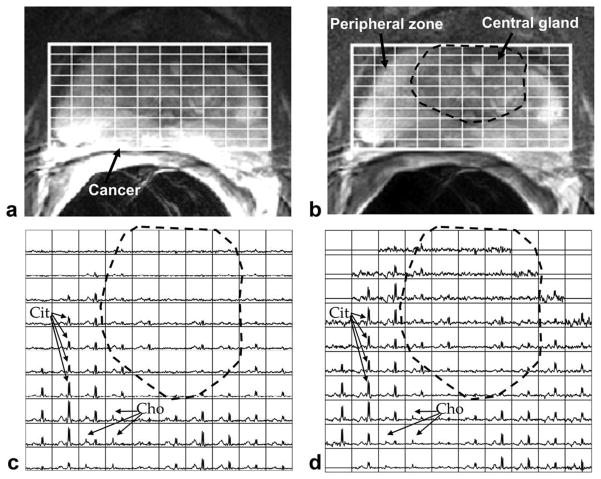
Materials and methods: A post-processing algorithm to correct for the endorectal coil reception effects on MRSI data was developed based upon theoretical modeling of the endorectal coil reception profile and of the spatial saturation pulse profiles. This algorithm was evaluated on three-dimensional (3D) MRSI data acquired at 3T from a uniform phantom and from 18 patients with known or suspected prostate cancer.

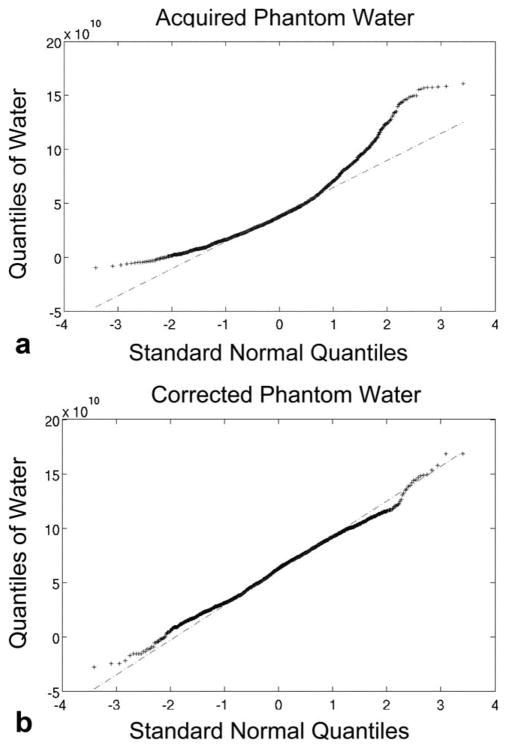
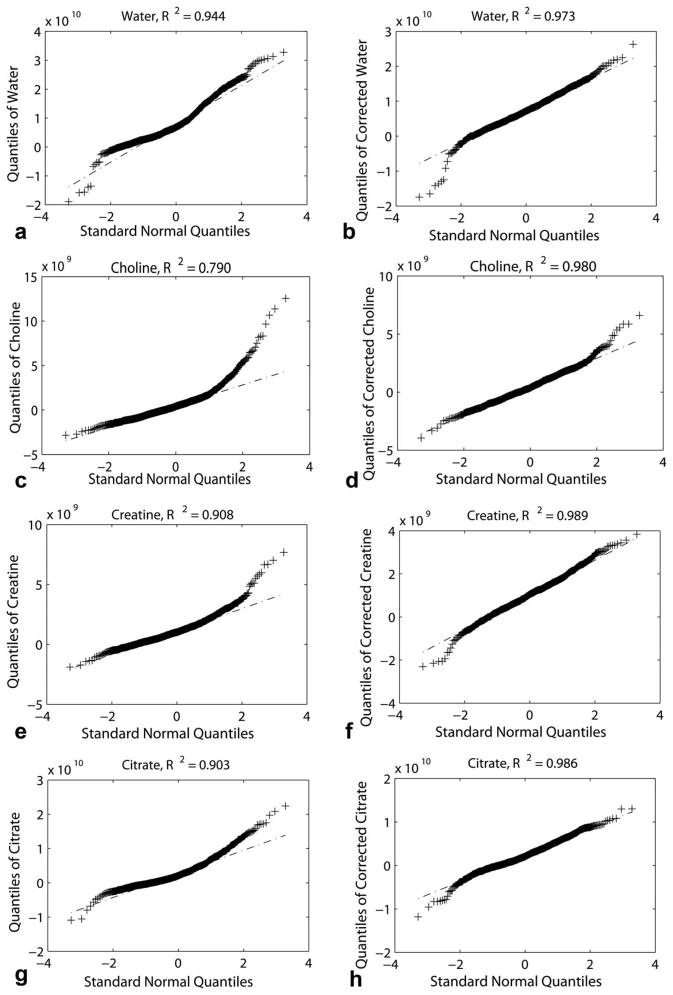
Results: For the phantom data, the coefficient of variation of metabolite peak areas decreased 16% to 46% and the peak area distributions became more Gaussian with correction, as demonstrated by higher Q-Q plot linear correlations (R(2) = 0.98 +/- 0.007 vs. R(2) = 0.89 +/- 0.066). Across the 18 patients, the mean coefficient of variation for suppressed water decreased significantly, from 0.95 +/- 0.18, to 0.66 +/- 0.11, (P < 10(-6), paired t-test) and the linear correlations of the Q-Q plots for the suppressed water increased from R(2) = 0.91 to R(2) = 0.95 (P = 0.0083, paired t-test) with correction.

Conclusion: An algorithm for reducing the effect of the inhomogeneous reception profile in endorectal coil acquired 3D MRSI prostate data was demonstrated, illustrating increased homogeneity and more Gaussian peak area distributions.


Figures

Figure 1
Figure 1
Identification of the coil location and rotation on (a) axial and (b) sagittal T2-weighted images. The two ends of the coil are marked with +’s. On the axial image, the locations are identified by the indentations in the rectal wall. On the sagittal image, the locations are identified by the dark streaks that emanate anteriorly and outward from the rectal wall at the superior and inferior ends of the balloon-inflated probe. [Color figure can be viewed in the online issue, which is available at wileyonlinelibrary.com.]
Figure 2
Figure 2
Assessment of coil correction of water peak areas from a uniform phantom using Q-Q plots of the distribution of the phantom water peak areas as compared to a normal distribution. Data is from the voxels having more than 90% of maximum excitation (within the PRESS selected region and not under the VSS sat bands). a: Before correction. b: After correction. There is clearly variability in the acquired data that is not all normal in distribution. Once corrected, the MRSI data is more uniform, with the non-normal effects mostly eliminated, as demonstrated by the Q-Q plot better linear fit of the data to a normal distribution (R2 = 0.99 vs. 0.89).
Figure 3
Figure 3
Image of a phantom with the VSS pulses demonstrating virtually complete suppression of signals within the VSS pulse bands (yellow hashed areas). The white box demarcates the PRESS selected region.
Figure 4
Figure 4
Example MRI and MRSI from a patient, demonstrating the increased uniformity with coil correction. a: Acquired axial MRI. b: Corrected MRI from (a). c: Acquired MRSI, with spectra from grid locations marked in (a). d: Coil corrected MRSI from (c). Cit = citrate, Cho = choline. The citrate peaks decrease anteriorly when acquired (in c) and are more uniform once corrected (in d). In addition to the artifacts due to the coil reception, the MRSI demonstrates biological heterogeneity among healthy peripheral zone tissue (outer, bright tissue), central gland tissue (central, primarily darker tissue, within dashed line) and peripheral zone cancer. The cancer is observable as decreased MRI intensity, clear choline, and markedly decreased citrate (area of spectra with labeled choline and some adjacent voxels).
Figure 5
Figure 5
Q-Q plots of water (a, b), choline (c, d), creatine (e, f), and citrate (g, h) before (a, c, e, g) and after (b, d, f, h) coil correction for the example subject in Fig. 4. All MRS measures become more normally distributed with coil correction.

References

    1. American Cancer Society. Cancer Facts & Figures 2008. Atlanta: American Cancer Society; 2008.
    1. Hatano K, Araki H, Sakai M, et al. Current status of intensity-modulated radiation therapy (IMRT) Int J Clin Oncol. 2007;12:408–415. - PubMed
    1. Hricak H, White S, Vigneron D, et al. Carcinoma of the prostate gland: MR imaging with pelvic phased-array coils versus integrated endorectal--pelvic phased-array coils. Radiology. 1994;193:703–709. - PubMed
    1. Kurhanewicz J, Vigneron DB, Hricak H, Narayan P, Carroll P, Nelson SJ. Three-dimensional H-1 MR spectroscopic imaging of the in situ human prostate with high (0.24–0.7-cm3) spatial resolution. Radiology. 1996;198:795–805. - PubMed
    1. Kurhanewicz J, Vigneron DB, Nelson SJ. Three-dimensional magnetic resonance spectroscopic imaging of brain and prostate cancer. Neoplasia. 2000;2:166–189. - PMC - PubMed

Publication types