Randomized Controlled Trial
. 2010 Aug;33(8):1013-26.
doi: 10.1093/sleep/33.8.1013.

Neurobehavioral dynamics following chronic sleep restriction: dose-response effects of one night for recovery

Affiliations
Randomized Controlled Trial

Neurobehavioral dynamics following chronic sleep restriction: dose-response effects of one night for recovery

Siobhan Banks et al. Sleep. 2010 Aug.

Abstract

Objective: Establish the dose-response relationship between increasing sleep durations in a single night and recovery of neurobehavioral functions following chronic sleep restriction.

Design: Intent-to-treat design in which subjects were randomized to 1 of 6 recovery sleep doses (0, 2, 4, 6, 8, or 10 h TIB) for 1 night following 5 nights of sleep restriction to 4 h TIB.

Setting: Twelve consecutive days in a controlled laboratory environment.

Participants: N = 159 healthy adults (aged 22-45 y), median = 29 y).

Interventions: Following a week of home monitoring with actigraphy and 2 baseline nights of 10 h TIB, subjects were randomized to either sleep restriction to 4 h TIB per night for 5 nights followed by randomization to 1 of 6 nocturnal acute recovery sleep conditions (N = 142), or to a control condition involving 10 h TIB on all nights (N = 17).

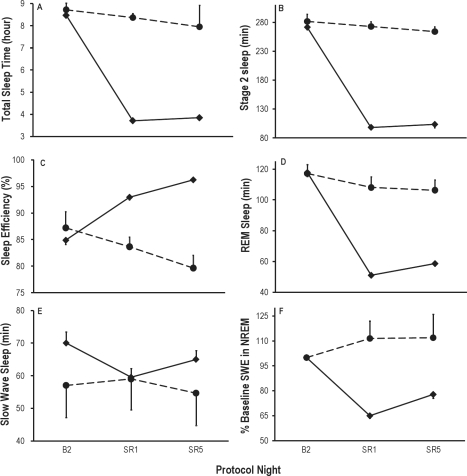
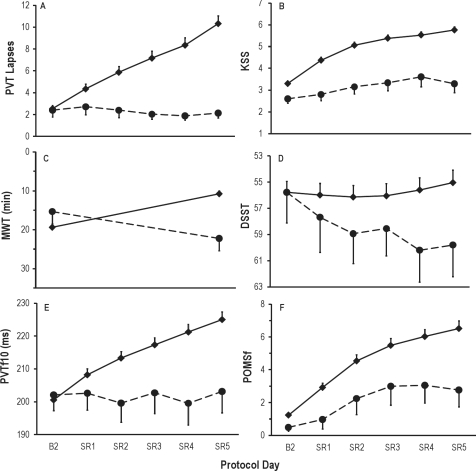
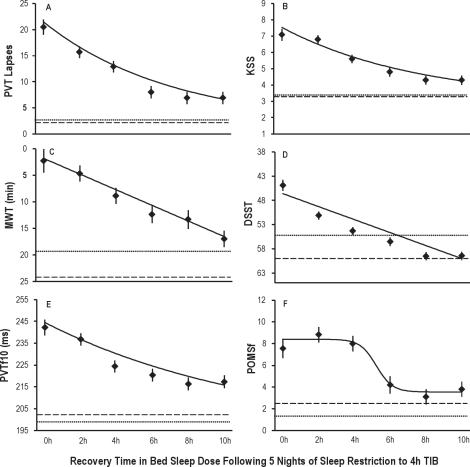
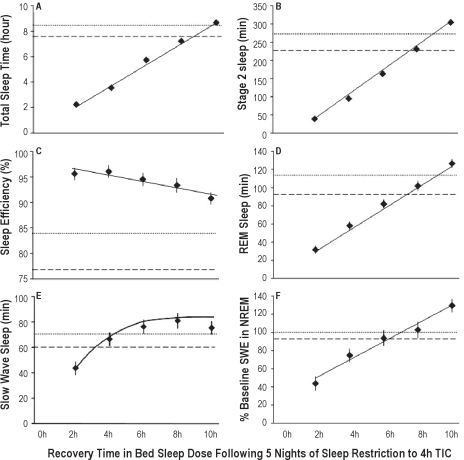
Measurements and results: Primary neurobehavioral outcomes included lapses on the Psychomotor Vigilance Test (PVT), subjective sleepiness from the Karolinska Sleepiness Scale (KSS), and physiological sleepiness from a modified Maintenance of Wakefulness Test (MWT). Secondary outcomes included psychomotor and cognitive speed as measured by PVT fastest RTs and number correct on the Digit Symbol Substitution Task (DSST), respectively, and subjective fatigue from the Profile of Mood States (POMS). The dynamics of neurobehavioral outcomes following acute recovery sleep were statistically modeled across the 0 h-10 h recovery sleep doses. While TST, stage 2, REM sleep and NREM slow wave energy (SWE) increased linearly across recovery sleep doses, best-fitting neurobehavioral recovery functions were exponential across recovery sleep doses for PVT and KSS outcomes, and linear for the MWT. Analyses based on return to baseline and on estimated intersection with control condition means revealed recovery was incomplete at the 10 h TIB (8.96 h TST) for PVT performance, KSS sleepiness, and POMS fatigue. Both TST and SWE were elevated above baseline at the maximum recovery dose of 10 h TIB.

Conclusions: Neurobehavioral deficits induced by 5 nights of sleep restricted to 4 h improved monotonically as acute recovery sleep dose increased, but some deficits remained after 10 h TIB for recovery. Complete recovery from such sleep restriction may require a longer sleep period during 1 night, and/or multiple nights of recovery sleep. It appears that acute recovery from chronic sleep restriction occurs as a result of elevated sleep pressure evident in both increased SWE and TST.


Figures

Figure 1
Figure 1
Mean ± SEM for sleep variables at baseline (B2 = 10 h TIB) and on the first (SR1) and fifth (SR5) nights of sleep restriction to 4 h TIB (04:00-08:00) for N = 118 sleep-restricted subjects (solid line), and N = 17 control subjects (dashed line) who received 10 h TIB (22:00-08:00) on all protocol nights. The effect sizes for the sleep parameters illustrated in Figure 1 are summarized in Supplement Table S1. As expected, sleep restriction decreased TST (graph A, P < 0.0001), stage 2 sleep (B, P < 0.0001), REM sleep (D, P < 0.0001), SWS (E, P < 0.0001), SWE (F, P < 0.0006), and increased sleep efficiency (C, P < 0.0001). There were small but reliable increases from SR1 to SR5 in TST (A, P < 0.0001), sleep efficiency (C, P < 0.0001), REM sleep (D, P < 0.0001), SWE (F, P < 0.0006), and SWS (E, P < 0.0006) but not stage 2 sleep (B, P > 0.05). The control group did not differ from the sleep restriction group on any of the sleep variables at baseline (all P > 0.2). Subjects in the control condition had a reduction in mean TST from 8.74 h on B2 to 7.95 h (P = 0.02) on the seventh night of 10 h TIB (equivalent night to SR5), and thus an 8% decrease in sleep efficiency across these nights, P = 0.02. No one specific aspect of sleep physiology accounted for the decreased TST across protocol nights (stage 2 sleep, P = 0.26; REM sleep, P = 0.85; SWS, P = 0.38; and SWE, P = 0.96).
Figure 2
Figure 2
Daily means (± SEM) of 6 neurobehavioral assessments in the sleep restriction group (N = 142, 4 h TIB for 5 nights [SR1-SR5], solid line), and the control group (N = 17, 10 h TIB on all nights, dashed line). All subjects had 10 h TIB (22:00-08:00) on baseline day 2 (B2). Sleep restriction on SR1 to SR5 was from 04:00 to 08:00. Data are plotted to show deficits in neurobehavioral functions increasing (upward) on the ordinate. Relative to the control condition, sleep restriction degraded all neurobehavioral functions over days (graph A, increased PVT lapses, P < 0.0001; B, increased KSS scores, P < 0.0001; C, decreased MWT sleep latency [assessed on B2 and SR5], P < 0.0001; D, decreased DSST number correct, P < 0.0001; E, increased PVT fastest RTs, P < 0.0001; F, increased POMS fatigue, P = 0.01). Control group performance on the DSST improved significantly (P = 0.002) across days due to learning (D), while MWT sleep latency increased significantly (P = 0.02) across days due to the extended (10h) TIB provided to control subjects each day (C).
Figure 3
Figure 3
Neurobehavioral outcomes as a function of increasing TIB dose (0 h-10 h) following the acute recovery (REC) night. N = 142 sleep restricted subjects were randomized to either 0 h TIB (n = 13), 2 h TIB (n = 27), 4 h TIB (n = 29), 6 h TIB (n = 25), 8 h TIB (n = 21), or 10 h TIB (n = 27). Least squares means (± SEM) are shown as diamonds for each REC sleep dose subgroup, controlling for covariates (i.e., baseline, cumulative deficits during sleep restriction, age, and sex). For comparison, horizontal dotted lines show baseline night (B2, 10 h TIB) values, and horizontal dashed lines show control group (N = 17) means on day 8 (10 h TIB), which is the day equivalent to REC. All neurobehavioral outcomes showed improvement as recovery sleep doses increased (graph A, PVT lapses decreased, P < 0.0001; B, KSS sleepiness decreased, P < 0.0001; C, MWT latencies increased, P < 0.0001; D, DSST number correct increased, P < 0.0001; E, PVT fastest RTs shortened, P < 0.0001; F, POMS fatigue decreased, P < 0.0001). Best-fitting recovery sleep dose-response functions (from AIC) are shown as the solid lines in each graph (see Supplement Tables S2 to S8). These functions are exponential with asymptote set to baseline (graphs A, B, E), linear (graphs C, D) and sigmoidal (graph F). Least squares means (diamonds) represent the overall covariate-controlled group means; best-fitting functions are shown for males with the other covariates set to the sample means.
Figure 4
Figure 4
Recovery night (REC) sleep variables as a function of increasing TIB dose from 2 h to 10 h. Least squares means (± SEM; data from N = 118 subjects with complete PSG data) are shown as diamonds for each REC sleep dose subgroup, controlling for covariates (i.e., baseline, age and sex). For comparison, horizontal dotted lines show baseline night (B2, 10 h TIB) data, and horizontal dashed lines show the control group (N = 17) means on day 8 (10 h TIB), which is the day equivalent to REC. Increasing REC TIB dose increased TST (graph A, P < 0.0001), stage 2 sleep (B, P < 0.0001), REM sleep (D, P < 0.0001), SWS (E, P < 0.0001), and SWE (F, P < 0.0001). Sleep efficiency decreased with increasing TIB (C, P = 0.039). Best-fitting recovery sleep dose-response functions (from AIC) are shown as the solid lines in each graph (see Supplement Table S10). These were linear for TST, stage 2, sleep efficiency, REM sleep, and SWE (graphs A, B, C, D, F, respectively) and exponential for SWS (graph E). Least squares means (diamonds) represent the overall covariate-controlled group means; best-fitting functions are shown for males with the other covariates set to the sample means.

References

    1. Banks S, Dinges DF. Behavioral and physiological consequences of sleep restriction. J Clin Sleep Med. 2007;3:519–28. - PMC - PubMed
    1. Basner M, Fomberstein KM, Razavi FM, et al. American time use survey: sleep time and its relationship to waking activities. Sleep. 2007;30:1085–95. - PMC - PubMed
    1. Dinges DF, Maislin G, Brewster RM, et al. Journal of the Transportation Research Board. Washington, DC: Transportation Research Board of the National Academies; 2005. Pilot test of fatigue management technologies; pp. 175–182. No. 1922.
    1. Roenneberg T, Wirz-Justice A, Merrow M. Life between clocks: Daily temporal patterns of human chronotypes. J Biol Rhythms. 2003;18:80–90. - PubMed
    1. Dijk D-J, Hayes B, Czeisler CA. Dynamics of electroencephalographic sleep spindles and slow wave activity in men: effect of sleep deprivation. Brain Res. 1993;626:190–9. - PubMed

Publication types

MeSH terms