. 2010 Sep 29;132(38):13486-94.
doi: 10.1021/ja105702y.

Structures of metallosupramolecular coordination assemblies can be obtained by ion mobility spectrometry-mass spectrometry

Affiliations

Structures of metallosupramolecular coordination assemblies can be obtained by ion mobility spectrometry-mass spectrometry

Erin R Brocker et al. J Am Chem Soc. .

Abstract

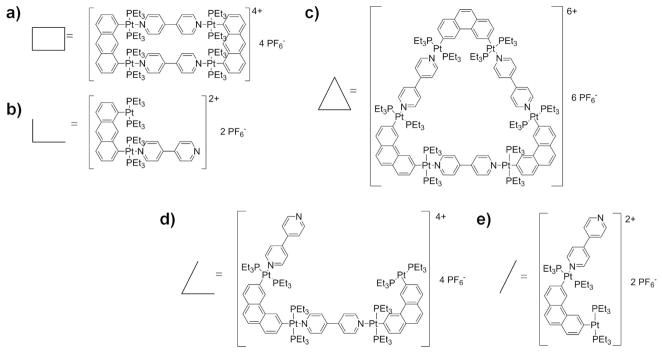
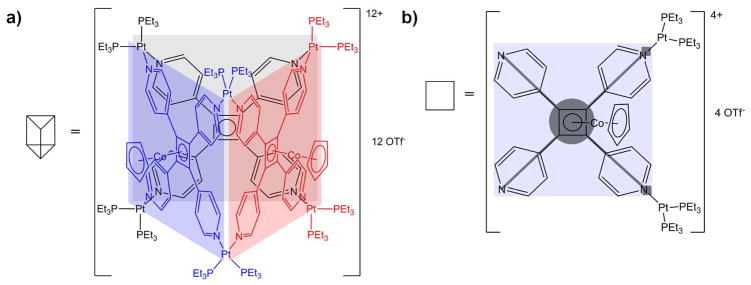
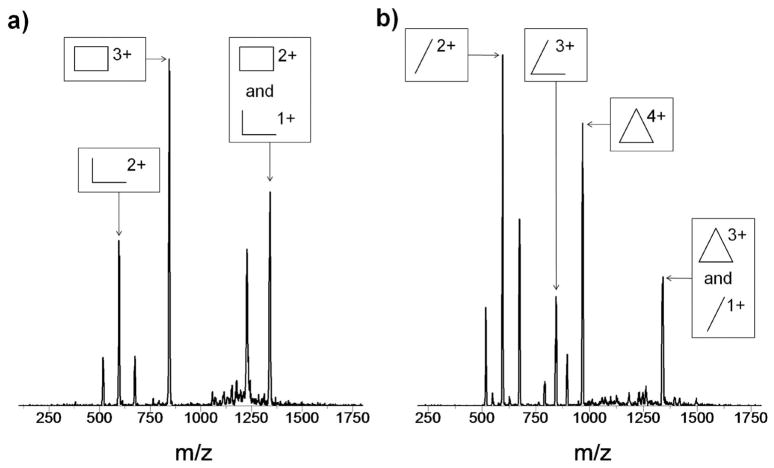
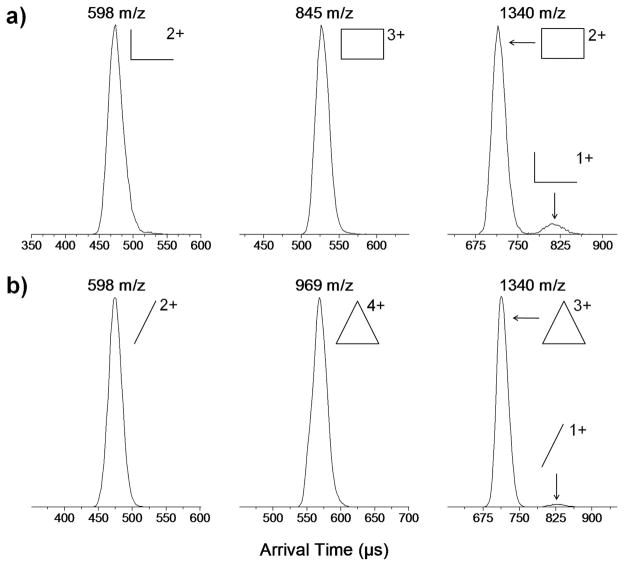
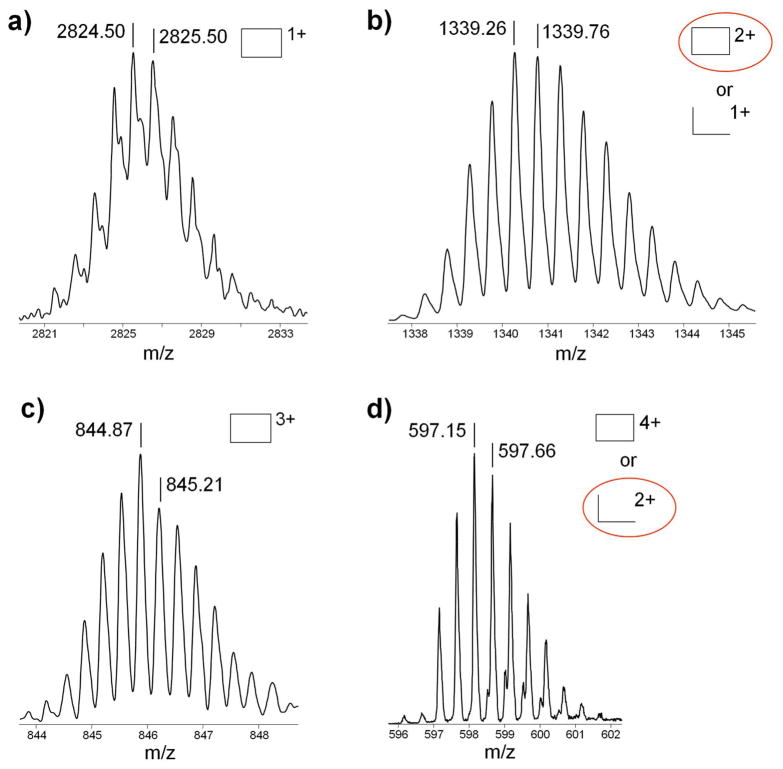
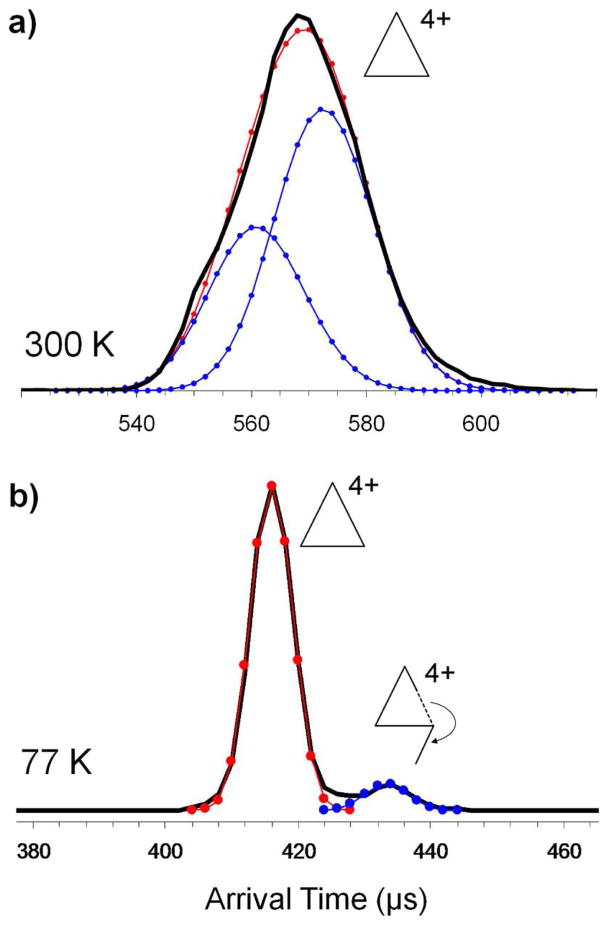
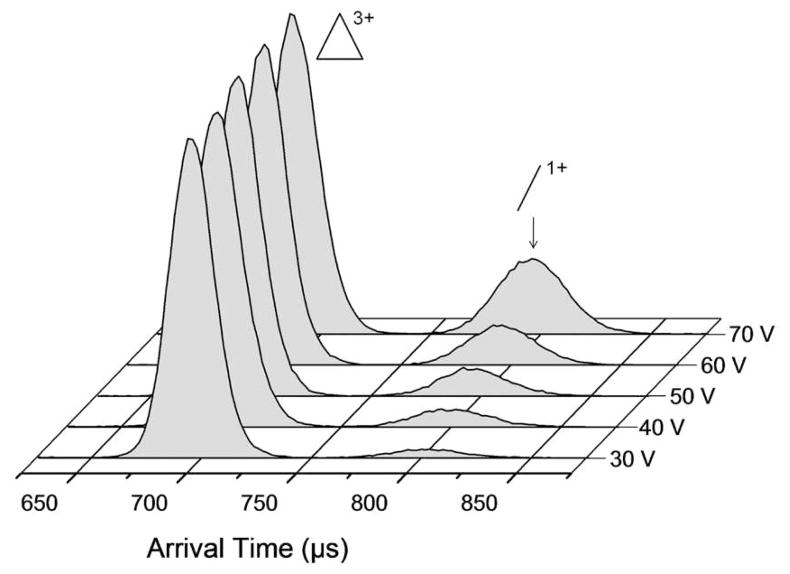
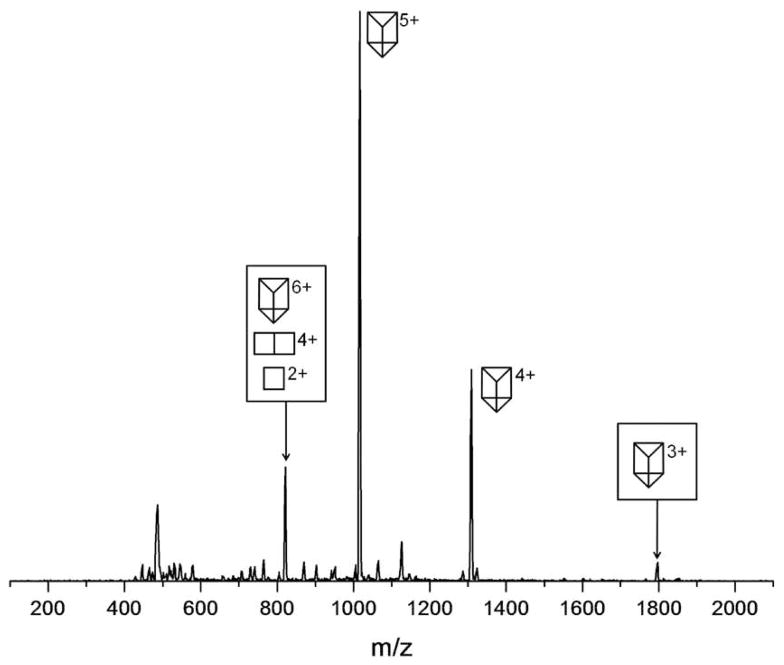
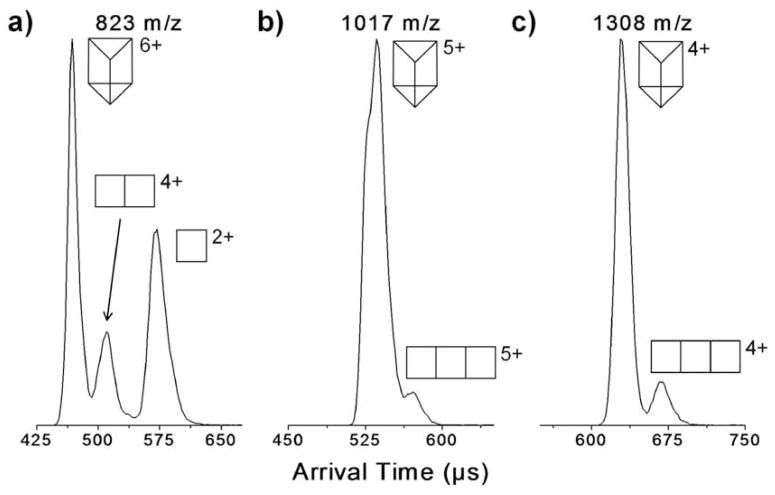
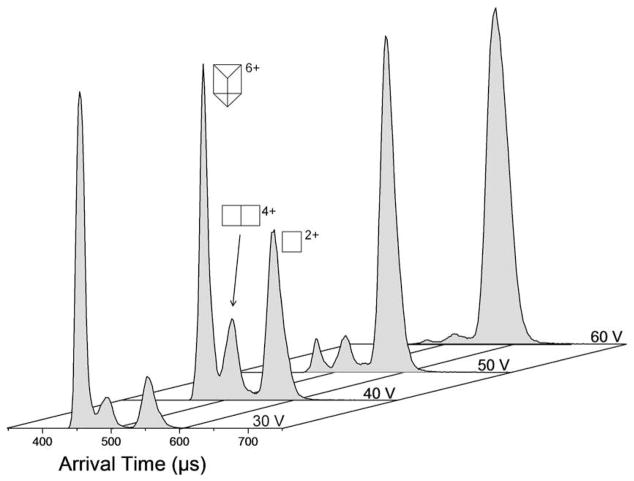
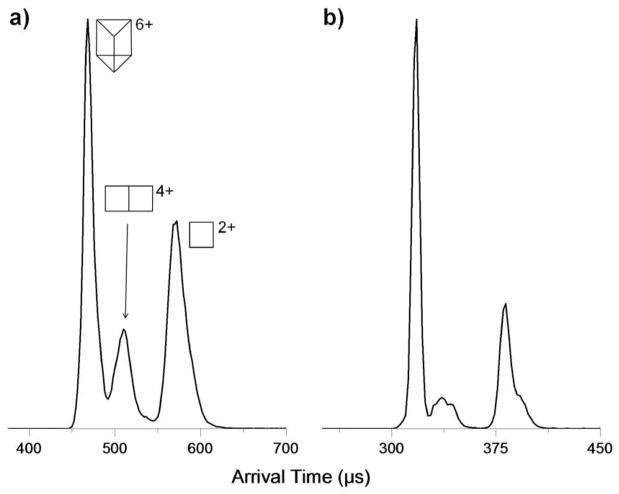
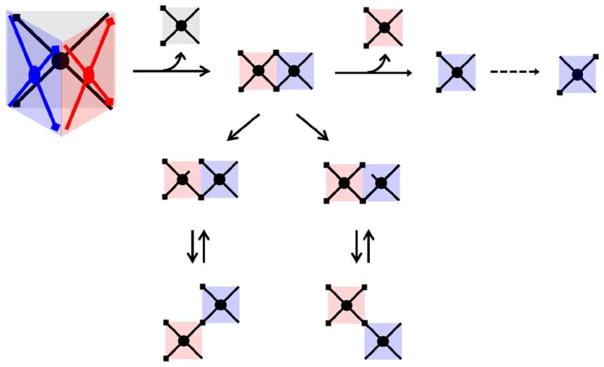
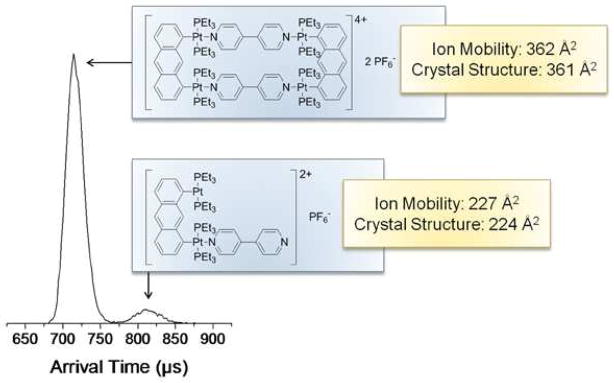
Rigid rectangular, triangular, and prismatic supramolecular assemblies, cyclobis[(2,9-bis[trans-Pt(PEt(3))(2)(PF(6))]anthracene)(4,4'-dipyridyl)], cyclotris[(2,9-bis[trans-Pt(PEt(3))(2)(PF(6))]phenanthrene)(4,4'-dipyridyl)], and cyclotris[bis[cis-Pt(PEt(3))(2)(CF(3)SO(3))(2)]tetrakis(4-pyridyl)cyclobutadienecyclopentadienylcobalt(I)], respectively, based on dipyridyl ligands and square planar platinum coordination, have been investigated by ion mobility spectrometry-mass spectrometry (IMS-MS). Electrospray ionization-quadrupole and time-of-flight spectra have been obtained and fragmentation pathways assigned. Ion mobility studies give cross sections that compare very well with cross sections of the supramolecular rectangle and triangle species on the basis of X-ray bond distances. For the larger prism structures, agreement of experimental and calculated cross sections from molecular modeling is very good, indicating IMS-MS methods can be used to characterize complex self-assembled structures where X-ray or other spectroscopic structures are not available.


Figures

Figure 1
Figure 1
Structures of (a) fully assembled Rect(PF6)4 and its (b) monomer fragment Rect1/2(PF6)2, and the (c) fully assembled Tri(PF6)6, (d) its dimer fragment Tri2/3(PF6)4 and (e) its monomer fragment Tri1/3(PF6)2.
Figure 2
Figure 2
Postulated structure of (a) the fully assembled Prism(OTf)12 and (b) its monomer Prism1/3(OTf)4. In (a) the rear Cp-Co group is omitted for clarity, and in (b) square boxes at the tip of the diagonal lines represent Pt2+ centers.
Figure 3
Figure 3
ESI-quadrupole mass spectra of Rect(PF6)4 and Tri(PF6)6 with peaks of interest assigned. For the structures representing each symbol, see Figure 1.
Figure 4
Figure 4
Arrival time distributions for the m/z corresponding to (a) the 2+, 3+, and 4+ charge states of the rectangle, and (b) the 3+, 4+, and 6+ charge states of the triangle.
Figure 5
Figure 5
Rectangle isotopic distributions for high resolution mass spectrum peaks (a) 2824 m/z with 1.0 amu spacing, (b) 1340 m/z with 0.5 amu spacing, (c) 845 m/z with 0.33 amu spacing, and (d) 598 m/z with 0.5 amu spacing The circled structure is the actual species present. See Figure 1 caption for symbol definitions. See Figure S1 in the Supplemental Information for comparison with simulated isotopic distributions.
Figure 6
Figure 6
ATDs of the [Tri(PF6)2]4+ peak at m/z 969 at (a) 300K and (b) 77K. The solid line is experiment and the connected dots the deconvoluted theoretical distribution.
Figure 7
Figure 7
Fragmentations of [Tri(PF6)3]3+ with increasing ion injection energy (IIE). ATDs have been normalized.
Figure 8
Figure 8
ESI-Quadrupole mass spectrum of Prism(OTf)12. The symbols represent intact parent ions or fragments consisting of 1 or 2 “side” panels.
Figure 9
Figure 9
ATDs for various prism charge states showing fragments at the same m/z.
Figure 10
Figure 10
Fragmentation of Prism(OTf)66+ with increasing ion injection energy (IIE). ATDs have been normalized.
Figure 11
Figure 11
Comparison of (a) 300K and (b) 77K Prism(OTf)66+, Prism2/3(OTf)44+, and Prism1/3(OTf)22+ structures at m/z 823. Broad features are resolved into a least two components for the +4 and +2 fragments.
Figure 12
Figure 12
Scheme for prism fragmentation giving +4 and +2 species and possible isomers. For an explanation of the symbols used, see Figure 2.
Figure 13
Figure 13
Low temperature ATD showing isomers assigned to the +4 and +2 charge states. The cross sections are those measured for the 300K unresolved peaks. The separation observed at 77K is consistent with the expected cross sections of the isomers shown.

References

    1. Silva APd, McCaughan B, McKinney BOF, Querol M. Dalton Trans. 2003:1902–1913.
    1. Sun LP, Niu SY, Jin J, Yang GD, Ye L. Inorg Chem Commun. 2006;9:679–682.
    1. Seidel SR, Stang PJ. Acc Chem Res. 2002;35:972–983. - PubMed
    1. Raymond KN, Andersen UN, Seeber G, Fiedler D, Lin D, Harris D. J Am Soc Mass Spectrom. 2006;17:292–296. - PubMed
    1. Tashiro S, Tominaga M, Yamaguchi Y, Kato K, Fujita M. Angew Chem Int Ed. 2006;45:241–244. - PubMed

Publication types

MeSH terms