

Classification of videocapsule endoscopy image patterns: comparative analysis between patients with celiac disease and normal individuals
- PMID: 20815911
- PMCID: PMC2941491
- DOI: 10.1186/1475-925X-9-44
Classification of videocapsule endoscopy image patterns: comparative analysis between patients with celiac disease and normal individuals
Abstract
Background: Quantitative disease markers were developed to assess videocapsule images acquired from celiac disease patients with villous atrophy, and from control patients.
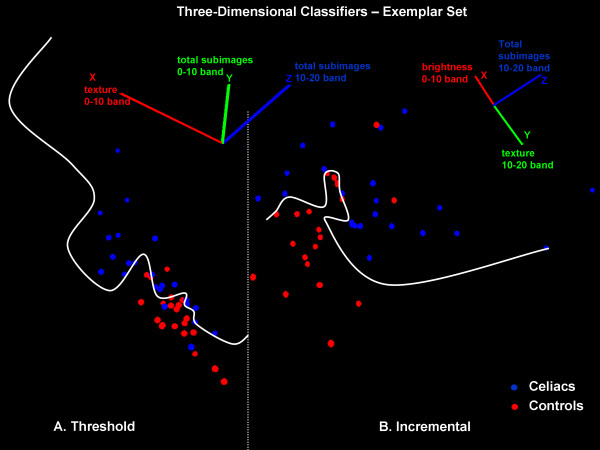
Method: Capsule endoscopy videoclip images (576 x 576 pixels) were acquired at 2/second frame rate (11 celiacs, 10 controls) at regions: 1. bulb, 2. duodenum, 3. jejunum, 4. ileum and 5. distal ileum. Each of 200 images per videoclip (= 100s) were subdivided into 10 x 10 pixel subimages for which mean grayscale brightness level and its standard deviation (texture) were calculated. Pooled subimage values were grouped into low, intermediate, and high texture bands, and mean brightness, texture, and number of subimages in each band (nine features in all) were used for quantifying regions 1-5, and to determine the three best features for threshold and incremental learning classification. Classifiers were developed using 6 celiac and 5 control patients' data as exemplars, and tested on 5 celiacs and 5 controls.
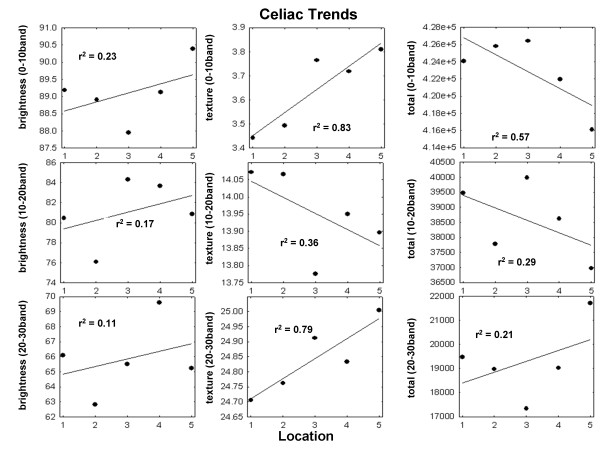
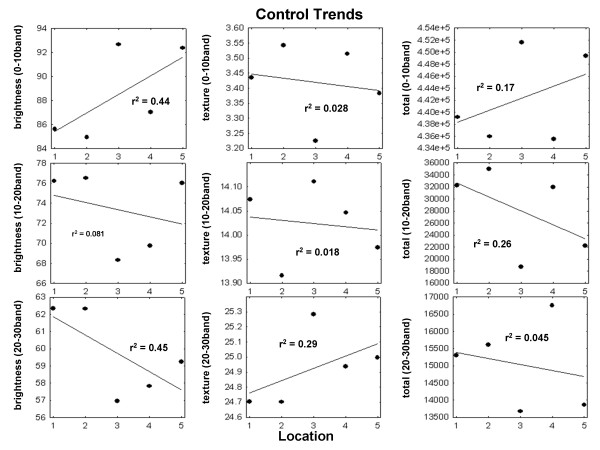
Results: Pooled from all regions, the threshold classifier had 80% sensitivity and 96% specificity and the incremental classifier had 88% sensitivity and 80% specificity for predicting celiac versus control videoclips in the test set. Trends of increasing texture from regions 1 to 5 occurred in the low and high texture bands in celiacs, and the number of subimages in the low texture band diminished (r(2) > 0.5). No trends occurred in controls.
Conclusions: Celiac videocapsule images have textural properties that vary linearly along the small intestine. Quantitative markers can assist in screening for celiac disease and localize extent and degree of pathology throughout the small intestine.
Figures


Similar articles
-
Transformation of videocapsule images to detect small bowel mucosal differences in celiac versus control patients.Comput Methods Programs Biomed. 2012 Oct;108(1):28-37. doi: 10.1016/j.cmpb.2011.12.008. Epub 2012 Jan 28. Comput Methods Programs Biomed. 2012. PMID: 22284703
-
Methods to quantitate videocapsule endoscopy images in celiac disease.Biomed Mater Eng. 2014;24(6):1895-911. doi: 10.3233/BME-140999. Biomed Mater Eng. 2014. PMID: 25226886 Review.
-
Color masking improves classification of celiac disease in videocapsule endoscopy images.Comput Biol Med. 2019 Mar;106:150-156. doi: 10.1016/j.compbiomed.2018.12.011. Epub 2018 Dec 24. Comput Biol Med. 2019. PMID: 30638623
-
Use of basis images for detection and classification of celiac disease.Biomed Mater Eng. 2014;24(6):1913-23. doi: 10.3233/BME-141000. Biomed Mater Eng. 2014. PMID: 25226887
-
Quantitative image analysis of celiac disease.World J Gastroenterol. 2015 Mar 7;21(9):2577-81. doi: 10.3748/wjg.v21.i9.2577. World J Gastroenterol. 2015. PMID: 25759524 Free PMC article. Review.
Cited by
-
Coeliac disease and the videocapsule: what have we learned till now.Ann Transl Med. 2017 May;5(9):197. doi: 10.21037/atm.2017.05.06. Ann Transl Med. 2017. PMID: 28567377 Free PMC article. Review.
-
Implementation of a polling protocol for predicting celiac disease in videocapsule analysis.World J Gastrointest Endosc. 2013 Jul 16;5(7):313-22. doi: 10.4253/wjge.v5.i7.313. World J Gastrointest Endosc. 2013. PMID: 23858375 Free PMC article.
-
Automated diagnosis of celiac disease by video capsule endoscopy using DAISY Descriptors.J Med Syst. 2019 Apr 26;43(6):157. doi: 10.1007/s10916-019-1285-6. J Med Syst. 2019. PMID: 31028562
-
Scale invariant texture descriptors for classifying celiac disease.Med Image Anal. 2013 May;17(4):458-74. doi: 10.1016/j.media.2013.02.001. Epub 2013 Feb 13. Med Image Anal. 2013. PMID: 23481171 Free PMC article.
-
Recommendations to quantify villous atrophy in video capsule endoscopy images of celiac disease patients.World J Gastrointest Endosc. 2016 Oct 16;8(18):653-662. doi: 10.4253/wjge.v8.i18.653. World J Gastrointest Endosc. 2016. PMID: 27803772 Free PMC article.
References
-
- Rondonotti E, Spada C, Cave D, Pennazio M, Riccioni ME, De Vitis I, Schneider D, Sprujevnik T, Villa F, Langelier J, Arrigoni A, Costamagna G, de Franchis R. Video Capsule Enteroscopy in the Diagnosis of Celiac Disease: A Multicenter Study. American J Gastroenterology. 2007;102:1624–1631. doi: 10.1111/j.1572-0241.2007.01238.x. - DOI - PubMed
Publication types
MeSH terms
LinkOut - more resources
Full Text Sources
Medical
