

Predicting ion binding properties for RNA tertiary structures
- PMID: 20816069
- PMCID: PMC2931721
- DOI: 10.1016/j.bpj.2010.06.029
Predicting ion binding properties for RNA tertiary structures
Abstract
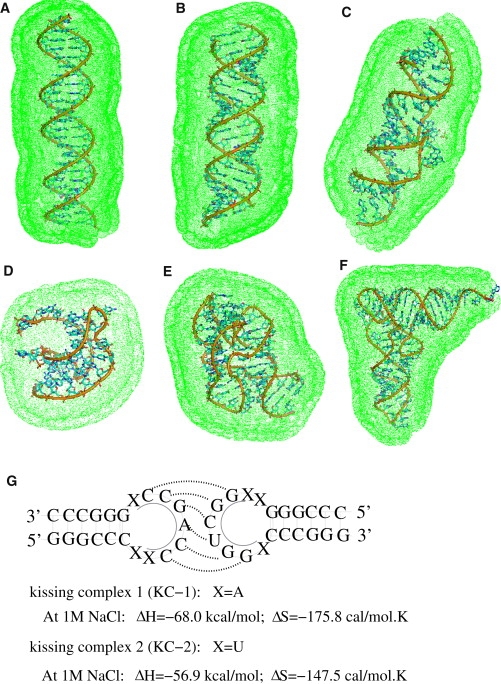
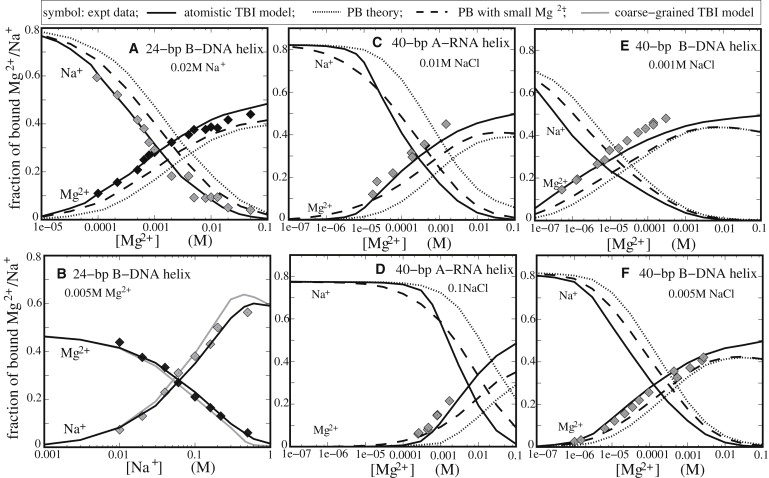
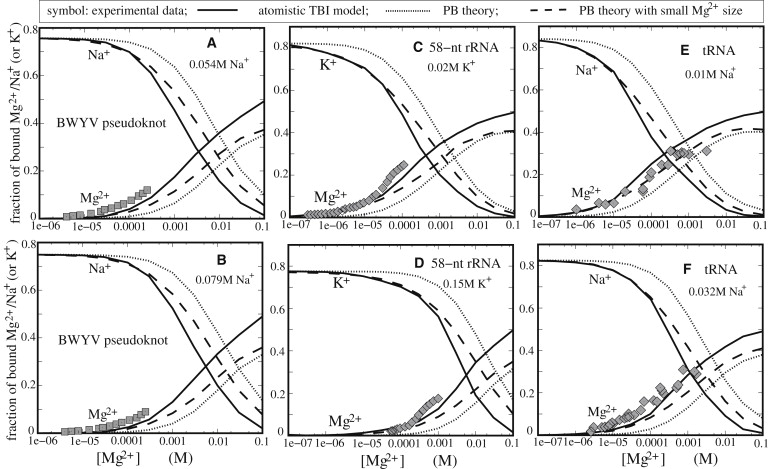
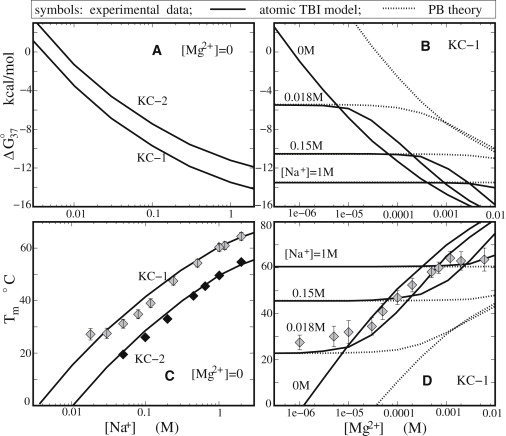
Recent experiments pointed to the potential importance of ion correlation for multivalent ions such as Mg(2+) ions in RNA folding. In this study, we develop an all-atom model to predict the ion electrostatics in RNA folding. The model can treat ion correlation effects explicitly by considering an ensemble of discrete ion distributions. In contrast to the previous coarse-grained models that can treat ion correlation, this new model is based on all-atom nucleic acid structures. Thus, unlike the previous coarse-grained models, this new model allows us to treat complex tertiary structures such as HIV-1 DIS type RNA kissing complexes. Theory-experiment comparisons for a variety of tertiary structures indicate that the model gives improved predictions over the Poisson-Boltzmann theory, which underestimates the Mg(2+) binding in the competition with Na(+). Further systematic theory-experiment comparisons for a series of tertiary structures lead to a set of analytical formulas for Mg(2+)/Na(+) ion-binding to various RNA and DNA structures over a wide range of Mg(2+) and Na(+) concentrations.
Copyright 2010 Biophysical Society. Published by Elsevier Inc. All rights reserved.
Figures
Similar articles
-
Predicting Ion Effects in an RNA Conformational Equilibrium.J Phys Chem B. 2017 Aug 31;121(34):8026-8036. doi: 10.1021/acs.jpcb.7b03873. Epub 2017 Aug 21. J Phys Chem B. 2017. PMID: 28780864 Free PMC article.
-
RNA helix stability in mixed Na+/Mg2+ solution.Biophys J. 2007 May 15;92(10):3615-32. doi: 10.1529/biophysj.106.100388. Epub 2007 Feb 26. Biophys J. 2007. PMID: 17325014 Free PMC article.
-
Competitive Binding of Mg2+ and Na+ Ions to Nucleic Acids: From Helices to Tertiary Structures.Biophys J. 2018 Apr 24;114(8):1776-1790. doi: 10.1016/j.bpj.2018.03.001. Biophys J. 2018. PMID: 29694858 Free PMC article.
-
RNA nucleotide methylation.Wiley Interdiscip Rev RNA. 2011 Sep-Oct;2(5):611-31. doi: 10.1002/wrna.79. Epub 2011 Mar 23. Wiley Interdiscip Rev RNA. 2011. PMID: 21823225 Review.
-
RNA folding: thermodynamic and molecular descriptions of the roles of ions.Biophys J. 2008 Dec 15;95(12):5489-95. doi: 10.1529/biophysj.108.131813. Epub 2008 Oct 3. Biophys J. 2008. PMID: 18835912 Free PMC article. Review.
Cited by
-
RNA 3D Structure Prediction: Progress and Perspective.Molecules. 2023 Jul 20;28(14):5532. doi: 10.3390/molecules28145532. Molecules. 2023. PMID: 37513407 Free PMC article. Review.
-
Potential of mean force between oppositely charged nanoparticles: A comprehensive comparison between Poisson-Boltzmann theory and Monte Carlo simulations.Sci Rep. 2017 Oct 26;7(1):14145. doi: 10.1038/s41598-017-14636-x. Sci Rep. 2017. PMID: 29074886 Free PMC article.
-
Structure folding of RNA kissing complexes in salt solutions: predicting 3D structure, stability, and folding pathway.RNA. 2019 Nov;25(11):1532-1548. doi: 10.1261/rna.071662.119. Epub 2019 Aug 7. RNA. 2019. PMID: 31391217 Free PMC article.
-
Predicting Ion Effects in an RNA Conformational Equilibrium.J Phys Chem B. 2017 Aug 31;121(34):8026-8036. doi: 10.1021/acs.jpcb.7b03873. Epub 2017 Aug 21. J Phys Chem B. 2017. PMID: 28780864 Free PMC article.
-
Counting the ions surrounding nucleic acids.Nucleic Acids Res. 2017 Feb 28;45(4):1596-1605. doi: 10.1093/nar/gkw1305. Nucleic Acids Res. 2017. PMID: 28034959 Free PMC article.
References
-
- Brion P., Westhof E. Hierarchy and dynamics of RNA folding. Annu. Rev. Biophys. Biomol. Struct. 1997;26:113–137. - PubMed
-
- Tinoco I., Jr., Bustamante C. How RNA folds. J. Mol. Biol. 1999;293:271–281. - PubMed
-
- Sosnick T.R., Pan T. RNA folding: models and perspectives. Curr. Opin. Struct. Biol. 2003;13:309–316. - PubMed
-
- Woodson S.A. Metal ions and RNA folding: a highly charged topic with a dynamic future. Curr. Opin. Chem. Biol. 2005;9:104–109. - PubMed
-
- Thirumalai D., Hyeon C. RNA and protein folding: common themes and variations. Biochemistry. 2005;44:4957–4970. - PubMed
Publication types
MeSH terms
Substances
LinkOut - more resources
Full Text Sources
