. 2010 Sep 8;99(5):1604-10.
doi: 10.1016/j.bpj.2010.06.026.

Conformational exchange in a membrane transport protein is altered in protein crystals

Affiliations

Conformational exchange in a membrane transport protein is altered in protein crystals

Daniel M Freed et al. Biophys J. .

Abstract

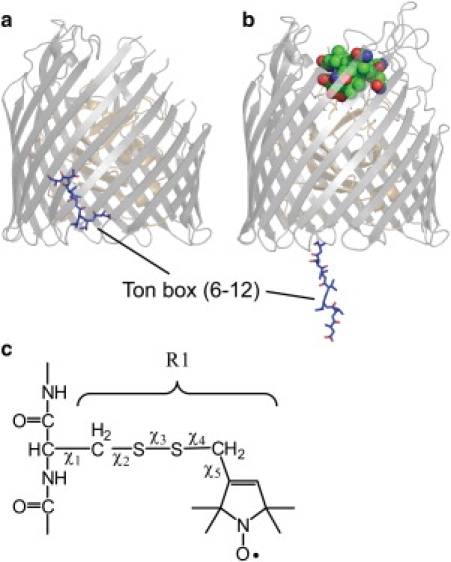
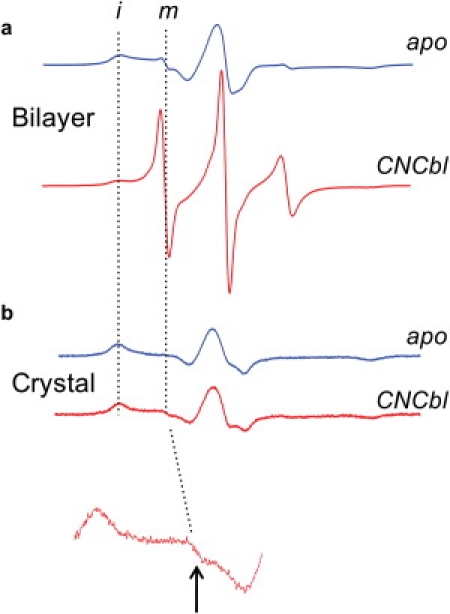
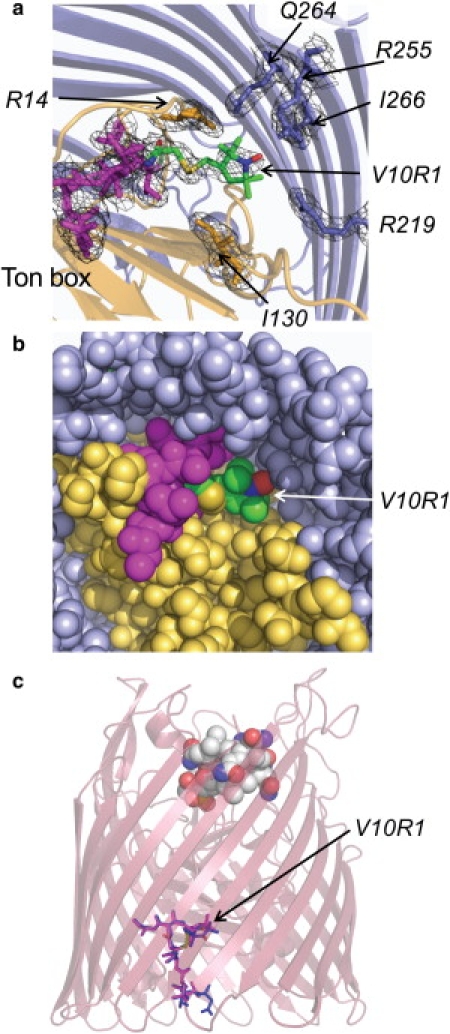
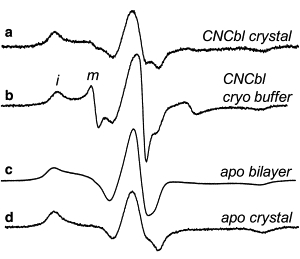
Successful macromolecular crystallography requires solution conditions that may alter the conformational sampling of a macromolecule. Here, site-directed spin labeling is used to examine a conformational equilibrium within BtuB, the Escherichia coli outer membrane transporter for vitamin B(12). Electron paramagnetic resonance (EPR) spectra from a spin label placed within the N-terminal energy coupling motif (Ton box) of BtuB indicate that this segment is in equilibrium between folded and unfolded forms. In bilayers, substrate binding shifts this equilibrium toward the unfolded form; however, EPR spectra from this same spin-labeled mutant indicate that this unfolding transition is blocked in protein crystals. Moreover, crystal structures of this spin-labeled mutant are consistent with the EPR result. When the free energy difference between substates is estimated from the EPR spectra, the crystal environment is found to alter this energy by 3 kcal/mol when compared to the bilayer state. Approximately half of this energy change is due to solutes or osmolytes in the crystallization buffer, and the remainder is contributed by the crystal lattice. These data provide a quantitative measure of how a conformational equilibrium in BtuB is modified in the crystal environment, and suggest that more-compact, less-hydrated substates will be favored in protein crystals.


Figures

Figure 1
Figure 1
BtuB in the (a) apo form where the Ton box position is highlighted (PDB ID: 1NQE). (b) Vitamin B12 bound form of BtuB showing the state of the Ton box as determined by EPR spectra and pulse EPR distance measurements (based upon PDB ID 1NQH and spectroscopic restraints obtained for the Ton box in bilayers (21)). This unfolding event places the Ton box as much as 30 Å into the periplasmic space. (c) The structure of the spin-labeled R1 side chain and dihedral angles that define the rotamers of R1.
Figure 2
Figure 2
EPR spectra for V10R1 with (red traces) and without (blue traces) substrate when BtuB is incorporated into (a) POPC bilayers, or (b) in the protein crystal. The inset below is a 10× vertical expansion showing a small signal from unfolded Ton box. The dashed vertical lines indicate the positions of signals resulting from immobilized (i) and mobile (m) nitroxide side chain, corresponding to folded and unfolded Ton box, respectively.
Figure 3
Figure 3
(a) Periplasmic view of the structure and electron density (1σ) showing the placement of the spin-labeled side chain V10R1 and residues that closely interact with the label in the apo form (PDB ID: 3M8B) of BtuB. (Magenta) Backbone of the Ton box. (Beige) N-terminal fold. (b) Periplasmic view of BtuB-V10R1 similar to that shown in panel a, except with van der Waals surfaces rendered for the atoms. The label, V10R1, is at the base of a periplasmic pocket in close tertiary contact with a number of atoms. (c) A comparison of the Ton box of BtuB-V10R1 with and without substrate. A side view of the crystal structure of the Ca2+-B12 bound form of V10R1 (PDB ID: 3M8D) is shown with B12 bound, and the Ton box (magenta). This structure was aligned with the apo form of BtuB-V10R1 where only the Ton box is rendered (blue).
Figure 4
Figure 4
EPR spectra from BtuB-V10R1 with bound ligand in (a) the protein crystal, (b) in the crystallization buffer at a protein concentration too dilute to form crystals, and in the apo state in (c) lipid bilayers and (d) the protein crystal. The symbols i and m indicate immobilized and mobile components in the spectra for panel b. The spectrum in panel c is identical to the spectrum in Fig. 2a, except that the small mobile component seen in Fig. 2a has been subtracted. All spectra are 100 Gauss scans.

References

    1. Frauenfelder H., Sligar S.G., Wolynes P.G. The energy landscapes and motions of proteins. Science. 1991;254:1598–1603. - PubMed
    1. Henzler-Wildman K., Kern D. Dynamic personalities of proteins. Nature. 2007;450:964–972. - PubMed
    1. Henzler-Wildman K.A., Lei M., Kern D. A hierarchy of timescales in protein dynamics is linked to enzyme catalysis. Nature. 2007;450:913–916. - PubMed
    1. Bahar I., Chennubhotla C., Tobi D. Intrinsic dynamics of enzymes in the unbound state and relation to allosteric regulation. Curr. Opin. Struct. Biol. 2007;17:633–640. - PMC - PubMed
    1. Swain J.F., Gierasch L.M. The changing landscape of protein allostery. Curr. Opin. Struct. Biol. 2006;16:102–108. - PubMed

Publication types

MeSH terms

LinkOut - more resources