. 2010 Dec;139(6):2061-2071.e2.
doi: 10.1053/j.gastro.2010.08.047. Epub 2010 Oct 20.

Intracellular calcium release and protein kinase C activation stimulate sonic hedgehog gene expression during gastric acid secretion

Affiliations

Intracellular calcium release and protein kinase C activation stimulate sonic hedgehog gene expression during gastric acid secretion

Mohamad El-Zaatari et al. Gastroenterology. 2010 Dec.

Abstract

Background & aims: Hypochlorhydria during Helicobacter pylori infection inhibits gastric Sonic Hedgehog (Shh) expression. We investigated whether acid-secretory mechanisms regulate Shh gene expression through intracellular calcium (Ca2(+)(i))-dependent protein kinase C (PKC) or cyclic adenosine monophosphate (cAMP)-dependent protein kinase A (PKA) activation.

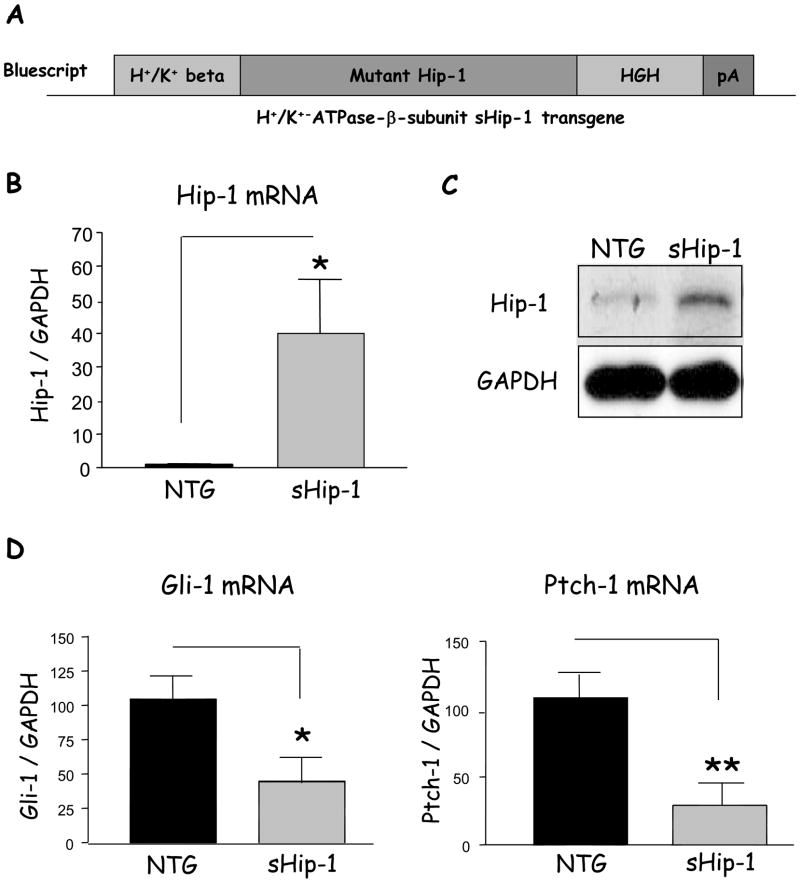
Methods: We blocked Hedgehog signaling by transgenically overexpressing a secreted form of the Hedgehog interacting protein-1, a natural inhibitor of hedgehog ligands, which induced hypochlorhydria. Gadolinium, ethylene glycol-bis(β-aminoethyl ether)-N,N,N',N'-tetraacetic acid (EGTA) + 1,2-bis(2-aminophenoxy)ethane-N,N,N',N'-tetraacetic acid (BAPTA), PKC-overexpressing adenoviruses, and PKC inhibitors were used to modulate Ca(2+)(i)-release, PKC activity, and Shh gene expression in primary gastric cell, organ, and AGS cell line cultures. PKA hyperactivity was induced in the H(+)/K(+)-β-cholera-toxin-overexpressing mice.

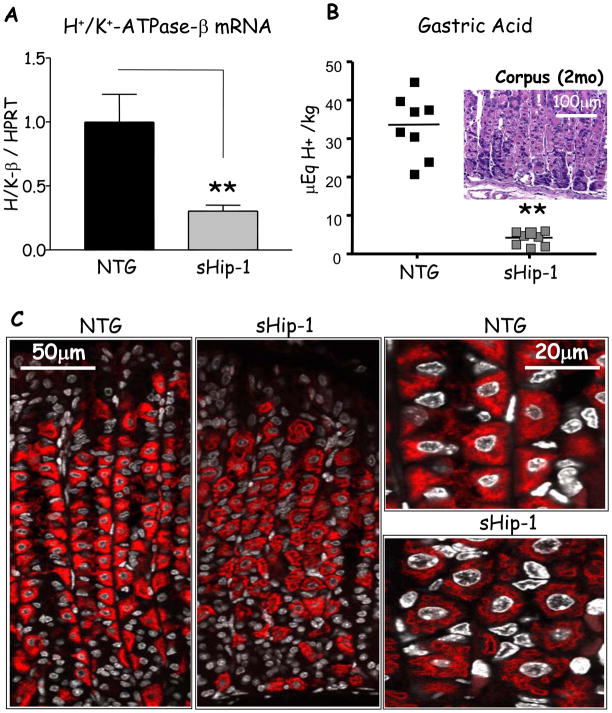
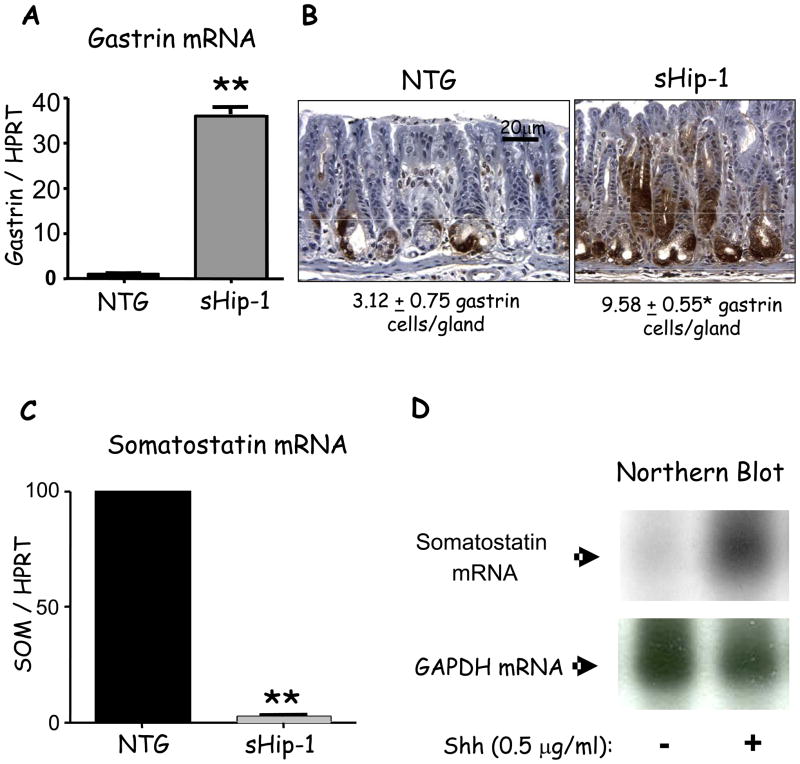
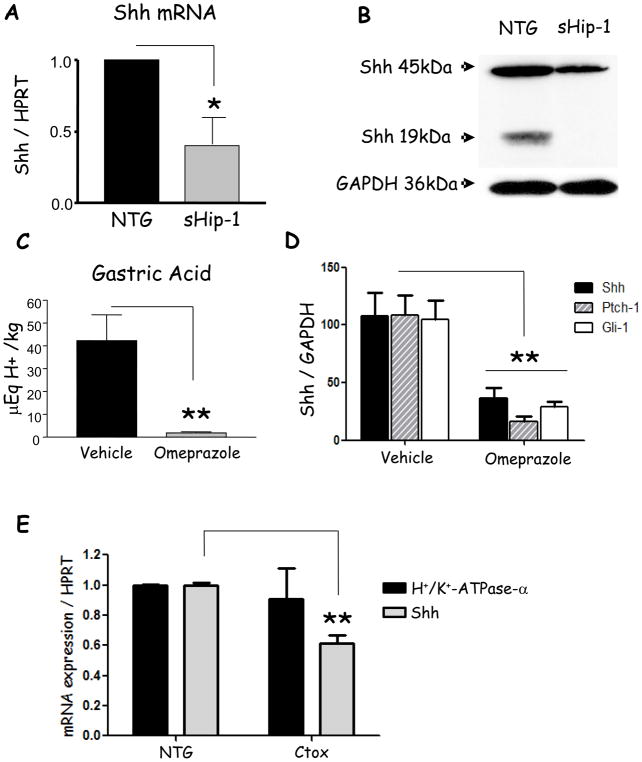
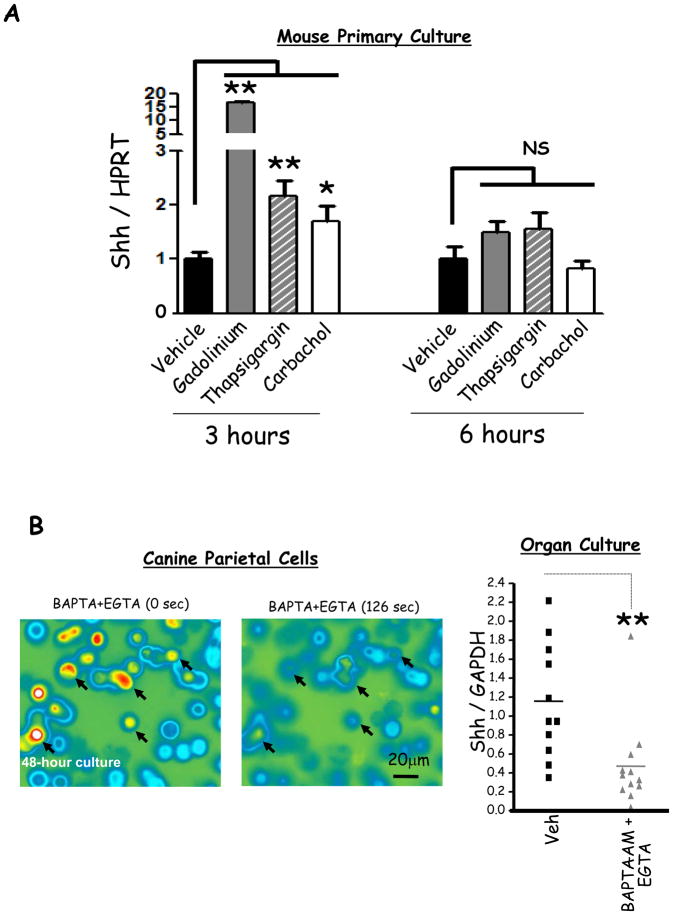
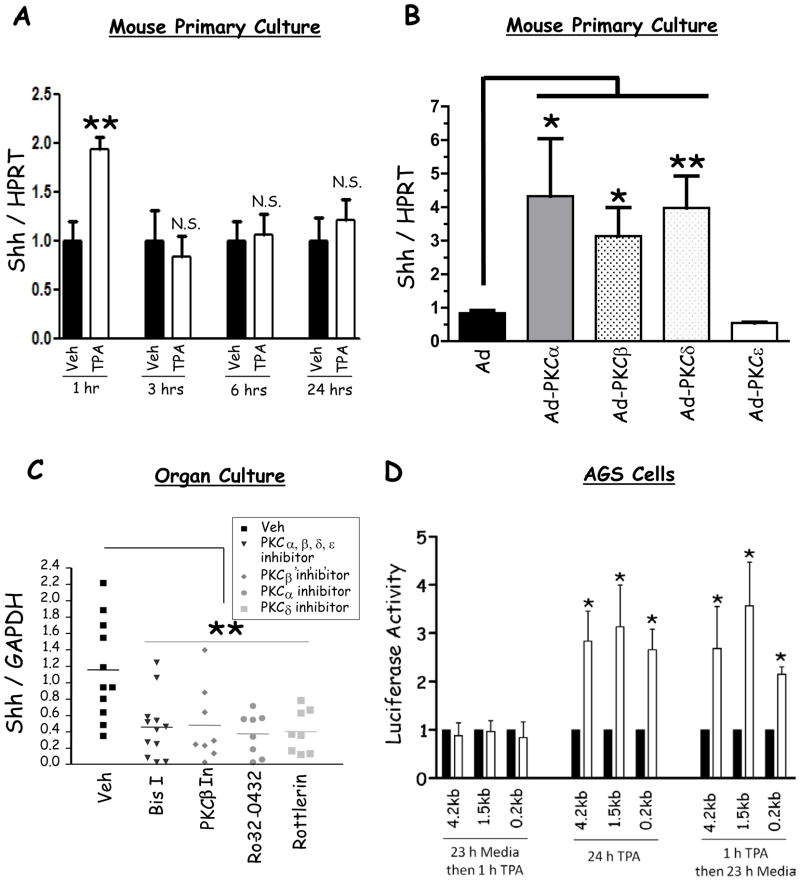
Results: Mice that expressed secreted hedgehog-interacting protein-1 had lower levels of gastric acid (hypochlorhydria), reduced production of somatostatin, and increased gastrin gene expression. Hypochlorhydria in these mice repressed Shh gene expression, similar to the levels obtained with omeprazole treatment of wild-type mice. However, Shh expression also was repressed in the hyperchlorhydric H(+)/K(+)-β-cholera-toxin model with increased cAMP, suggesting that the regulation of Shh was not solely acid-dependent, but pertained to specific acid-stimulatory signaling pathways. Based on previous reports that Ca(2+)(i) release also stimulates acid secretion in parietal cells, we showed that gadolinium-, thapsigargin-, and carbachol-mediated release of Ca(2+)(i) induced Shh expression. Ca(2+)-chelation with BAPTA + EGTA reduced Shh expression. Overexpression of PKC-α, -β, and -δ (but not PKC-ϵ) induced an Shh gene expression. In addition, phorbol esters induced a Shh-regulated reporter gene.

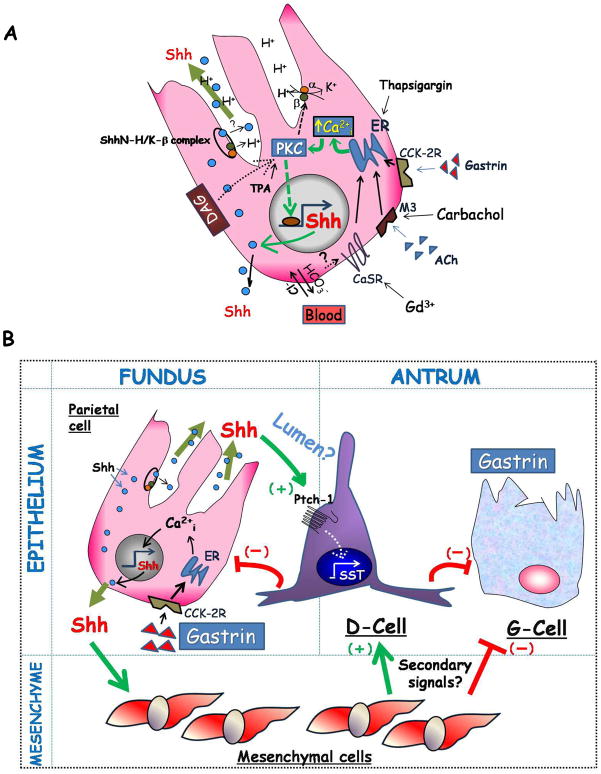
Conclusions: Secretagogues that stimulate gastric acid secretion induce Shh gene expression through increased Ca(2+)(i)-release and PKC activation. Shh might be the ligand transducing changes in gastric acidity to the regulation of G-cell secretion of gastrin.


Figures

Figure 1
Figure 1. Hip-1 mRNA levels and Shh signaling in the gastric fundus of transgenic mice
A) The secreted hedgehog interacting protein 1 (sHip-1) transgene, lacking the C-terminal transmembrane domain, was expressed downstream of the H+/K+-ATPase-β subunit promoter, and in frame with the 3′UTR of the human growth hormone (HGH) gene and polyA tail to enhance expression in mammalian cells. The mice expressing the transgene were designated as “sHip-1 mice”. B) Quantitative PCR analysis of Hip-1 mRNA from the sHip-1 mice compared to non-transgenic littermate is shown as the mean +/− SEM for 5 mice per group. C) A representative western blot of Hip-1 protein (85kDa) from a sHip-1 mouse (Founder line 450) compared to non-transgenic littermate is shown. D) Target gene expression of glioma-associated oncogene-1 (Gli-1) and Ptch-1 genes in the sHip-1 fundus versus controls to assay the signaling activity of the Shh pathway (shown is the mean for n = 5 mice per group +/− SEM). P-values are indicated such that * P < 0.05 and ** P < 0.01.
Figure 2
Figure 2. H+/K+-ATPase-β expression and acid production in sHip-1 mice
A) H+/K+-ATPase-β mRNA expression in the sHip-1 fundus versus non-transgenic littermate measured by RT-qPCR (shown is the mean for n = 5 mice per group +/− SEM). B) Gastric acidity measured by base titration in sHip-1 versus non-transgenic mice. B) (insert) Histological examination of the sHip-1 gastric mucosa. C) H+/K+-ATPase-β subunit staining (red) in the sHip-1 mice and non-transgenic controls. Low and high-power confocal images are shown in the left and right panels respectively. The DAPI nuclear stain is pseudo-colored in grey. P-values are indicated such that ** P < 0.01.
Figure 3
Figure 3. Gastrin and somatostatin mRNA expression levels in sHip-1 mice
A) Gastrin gene expression relative to hypoxanthine–guanine phosphoribosyltransferase (HPRT) in the sHip-1 antrum versus control mice measured by RT-qPCR. Shown is the mean for n = 3 mice +/− SEM. B) Morphometric quantitation of gastrin protein immunostaining in the sHip-1 antrum versus control mice. C) Somatostatin mRNA expression measured by RT-qPCR in the sHip-1 antrum versus non-transgenic littermate. Shown is the mean for n = 3 mice +/− SEM. D) Northern blot of somatostatin expression in an enriched culture of primary canine D-cells treated with or without 0.5μg/ml recombinant 19kDa Shh peptide. D-cells constitute 70% of the cells in the enriched culture. ** P < 0.01.
Figure 4
Figure 4. Shh mRNA expression in sHip-1, omeprazole-treated, and Ctox mice
A) RT-qPCR demonstrating Shh mRNA expression in the gastric fundus of sHip-1 mice compared to non-transgenic controls. B) Representative western blot of full-length and processed Shh protein in the gastric fundus of sHip-1 mice versus non-transgenic controls. C) Gastric acidity measured by base titration in omeprazole versus vehicle-treated mice. D) RT-qPCR of Shh, Gli-1, and Ptch-1 mRNA expression from the gastric fundus of omeprazole- versus vehicle-treated mice. E) RT-qPCR of Shh and H+/K+-ATPase-α mRNA expression from the gastric fundus of Ctox versus non-transgenic mice. Shown are the means for n = 5 mice per group +/− SEM (for Ctox mice n = 3). P-values are indicated such that * P < 0.05 and ** P < 0.01.
Figure 5
Figure 5. Effect of Ca2+i release on Shh mRNA expression
A) Shh mRNA expression in mouse primary fundic culture following gadolinium (Gd3+, 0.5 mM), thapsigargin (1 μM) and carbachol (100 μM) versus vehicle treatment for 3 or 6 hours. Shown is the mean of 6 experiments +/− SEM. B) Left Panel, Fura-2 imaging of canine parietal cells with high levels of Ca2+i after 48-hour culture before and after perfusion with EGTA (4mM) plus BAPTA-AM (10μM). Arrows indicate cultured parietal cells in which Ca2+i were depleted after the perfusion. Right Panel, RT-qPCR of Shh mRNA from mouse fundic organ cultures treated with EGTA (4mM) plus BAPTA-AM (10μM) versus vehicle for 12 hours. Each data point is one mouse. * P < 0.05 and ** P < 0.01.
Figure 6
Figure 6. Effect of PKC on Shh expression in mouse primary cells and gastric cell lines
A) RT-qPCR for Shh mRNA expression before and after TPA treatment for 1, 3, 6, and 24 hours (shown is the mean of 3 experiments +/− SEM). B) RT-qPCR of Shh mRNA from mouse primary fundic cell cultures transduced with adenoviral vectors overexpressing PKC-α, β, δ, ε, and empty vector (shown is the mean of 6 experiments +/− SEM). The cells were treated with 50 MOI of each of the individual adenoviruses. C) RT-qPCR measuring Shh in mouse fundic organ cultures treated with Bisindolylmaleimide I (Bis I, inhibits α, β, δ, and ε), PKC-β inhibitor, Ro-32-0432 (PKC-α inhibitor), and rottlerin (PKC-δ inhibitor). Each data point indicates one mouse. D) Shh-luciferase reporter activity normalized to Renilla luciferase in AGS cells treated with TPA versus vehicle. The figure demonstrates the reporter activity of the 0.2kb, 1.5kb, and 4.2kb promoters after 23 h incubation in media followed by 1 h TPA, 24 h TPA treatment, and 1 h TPA followed by 23 h incubation in media (shown is the mean of 3 experiments +/− SEM). * P < 0.05 and ** P < 0.01.
Figure 7
Figure 7. Hypothetical model of Shh in the gastric mucosa
A) Shown are three mechanisms capable of stimulating acid secretion through an increase in Ca2+i released from the endoplasmic and sarcoplasmic reticulae: 1) hormonal-stimulation with gastrin, 2) cholinergic stimulation with acetylecholine (ACh) through the M3 muscarinic receptor, or 3) alkalinization of the basolateral surface by extruded HCO3− ions leading to the activation of the calcium-sensing receptor (CaSR). Stimulation of acid secretion by histamine release from enterochromaffin-like cells is not shown. Ca2+i-release stimulates acid secretion and Shh gene expression via PKC α and β. PKC-δ might also mediate diacylglycerol (DAG)-induction of Shh gene expression. DAG also stimulates Ca2+i-release and acid secretion. The compounds used in this study, gadolinium (Gd3+), carbachol, thapsigargin and TPA, all stimulated Shh gene expression and are known to increase Ca2+i. Shh protein undergoes processing (intracellular location not defined), migrates to the basolateral membrane, or co-migrates with the H+/K+-ATPase-β subunit to the apical membrane where it is likely to be secreted luminally. B) Luminal Shh potentially targets epithelial cells expressing Ptch-1 such as D-cells to induce non-canonical signaling. In addition, Shh protein reaching the basolateral membrane would target Gli-1-positive mesenchymal cells inducing a secondary signal from the mesenchyme. The outcome of Shh signaling is to induce somatostatin (SST) that in turn inhibits the G-cell and gastrin production, and acid secretion from the parietal cell through paracrine mechanisms.

Comment in

References

    1. van den Brink GR, Hardwick JC, Tytgat GN, Brink MA, Ten Kate FJ, Van Deventer SJ, Peppelenbosch MP. Sonic hedgehog regulates gastric gland morphogenesis in man and mouse. Gastroenterology. 2001;121:317–28. - PubMed
    1. El-Zaatari M, Grabowska AM, McKenzie AJ, Powe DG, Scotting PJ, Watson SA. Cyclopamine inhibition of the sonic hedgehog pathway in the stomach requires concomitant acid inhibition. Regul Pept. 2008;146:131–9. - PubMed
    1. Zavros Y, Orr MA, Xiao C, Malinowska DH. Sonic hedgehog is associated with H+-K+-ATPase-containing membranes in gastric parietal cells and secreted with histamine stimulation. Am J Physiol Gastrointest Liver Physiol. 2008;295:G99–G111. - PMC - PubMed
    1. Stepan V, Ramamoorthy S, Nitsche H, Zavros Y, Merchant JL, Todisco A. Regulation and function of the sonic hedgehog signal transduction pathway in isolated gastric parietal cells. J Biol Chem. 2005;280:15700–8. - PubMed
    1. Zavros Y, Waghray M, Tessier A, Bai L, Todisco A, DLG, Samuelson LC, Dlugosz A, Merchant JL. Reduced pepsin A processing of sonic hedgehog in parietal cells precedes gastric atrophy and transformation. J Biol Chem. 2007;282:33265–74. - PubMed

Publication types

MeSH terms