

Development of an image analysis screen for estrogen receptor alpha (ERα) ligands through measurement of nuclear translocation dynamics
- PMID: 20816963
- PMCID: PMC2976052
- DOI: 10.1016/j.jsbmb.2010.08.009
Development of an image analysis screen for estrogen receptor alpha (ERα) ligands through measurement of nuclear translocation dynamics
Abstract
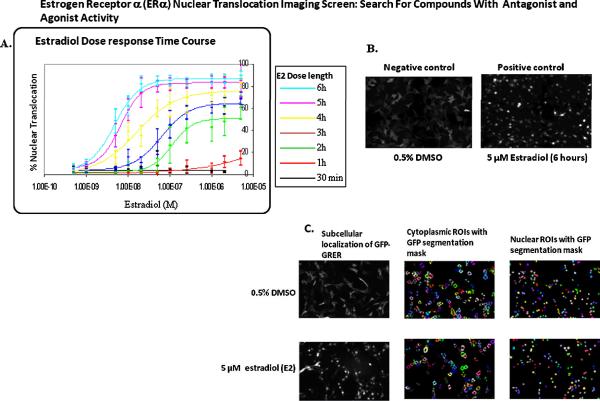
We have developed a robust high-content assay to screen for novel estrogen receptor alpha (ERα) agonists and antagonists by quantitation of cytoplasmic to nuclear translocation of an estrogen receptor chimera in 384-well plates. The screen utilizes a green fluorescent protein tagged-glucocorticoid/estrogen receptor (GFP-GRER) chimera which consisted of the N-terminus of the glucocorticoid receptor fused to the human ER ligand binding domain. The GFP-GRER exhibited cytoplasmic localization in the absence of ERα ligands, and translocated to the nucleus in response to stimulation with ERα agonists or antagonists. The BD Pathway 435 imaging system was used for image acquisition, analysis of translocation dynamics, and cytotoxicity measurements. The assay was validated with known ERα agonists and antagonists, and the Library of Pharmacologically Active Compounds (LOPAC 1280). Additionally, screening of crude natural product extracts demonstrated the robustness of the assay, and the ability to quantitate the effects of toxicity on nuclear translocation dynamics. The GFP-GRER nuclear translocation assay was very robust, with z' values >0.7, CVs <5%, and has been validated with known ER ligands, and inclusion of cytotoxicity filters will facilitate screening of natural product extracts. This assay has been developed for future primary screening of synthetic, pure natural products, and natural product extracts libraries available at the National Cancer Institute at Frederick.
Copyright © 2010 Elsevier Ltd. All rights reserved.
Figures


Similar articles
-
Identification of compounds by high-content screening that induce cytoplasmic to nuclear localization of a fluorescent estrogen receptor α chimera and exhibit agonist or antagonist activity in vitro.J Biomol Screen. 2014 Feb;19(2):242-52. doi: 10.1177/1087057113504136. Epub 2013 Sep 19. J Biomol Screen. 2014. PMID: 24051224 Free PMC article.
-
Potential use of an estrogen-glucocorticoid receptor chimera as a drug screen for tissue selective estrogenic activity.Bone. 2009 Jan;44(1):102-12. doi: 10.1016/j.bone.2008.09.016. Epub 2008 Oct 11. Bone. 2009. PMID: 18976723
-
An estrogen receptor chimera senses ligands by nuclear translocation.J Steroid Biochem Mol Biol. 2005 Dec;97(4):307-21. doi: 10.1016/j.jsbmb.2005.06.033. Epub 2005 Sep 12. J Steroid Biochem Mol Biol. 2005. PMID: 16162406
-
Molecular mechanisms of estrogen action: selective ligands and receptor pharmacology.J Steroid Biochem Mol Biol. 2000 Nov 30;74(5):279-85. doi: 10.1016/s0960-0760(00)00104-7. J Steroid Biochem Mol Biol. 2000. PMID: 11162936 Review.
-
Recent advances in peptidomimetics antagonists targeting estrogen receptor α-coactivator interaction in cancer therapy.Bioorg Med Chem Lett. 2018 Sep 15;28(17):2827-2836. doi: 10.1016/j.bmcl.2018.05.062. Epub 2018 May 31. Bioorg Med Chem Lett. 2018. PMID: 30025900 Review.
Cited by
-
Matching the power of high throughput screening to the chemical diversity of natural products.Nat Prod Rep. 2013 Oct 11;30(10):1284-98. doi: 10.1039/c3np70052f. Epub 2013 Aug 8. Nat Prod Rep. 2013. PMID: 23925671 Free PMC article. Review.
-
Identification of compounds by high-content screening that induce cytoplasmic to nuclear localization of a fluorescent estrogen receptor α chimera and exhibit agonist or antagonist activity in vitro.J Biomol Screen. 2014 Feb;19(2):242-52. doi: 10.1177/1087057113504136. Epub 2013 Sep 19. J Biomol Screen. 2014. PMID: 24051224 Free PMC article.
-
Functional genomic and high-content screening for target discovery and deconvolution.Expert Opin Drug Discov. 2012 Oct;7(10):955-68. doi: 10.1517/17460441.2012.711311. Epub 2012 Aug 4. Expert Opin Drug Discov. 2012. PMID: 22860749 Free PMC article. Review.
References
-
- Grodin JM, Siiteri PK, MacDonald PC. Source of estrogen production in postmenopausal women. The Journal of clinical endocrinology and metabolism. 1973;36(2):207–214. - PubMed
-
- Russo J, Reina D, Frederick J, Russo IH. Expression of phenotypical changes by human breast epithelial cells treated with carcinogens in vitro. Cancer research. 1988;48(10):2837–2857. - PubMed
-
- Russo J, Calaf G, Russo IH. A critical approach to the malignant transformation of human breast epithelial cells with chemical carcinogens. Critical reviews in oncogenesis. 1993;4(4):403–417. - PubMed
-
- Cavalieri EL, Kumar S, Todorovic R, Higginbotham S, Badawi AF, Rogan EG. Imbalance of estrogen homeostasis in kidney and liver of hamsters treated with estradiol: implications for estrogen-induced initiation of renal tumors. Chemical research in toxicology. 2001;14(8):1041–1050. - PubMed
-
- Devanesan P, Todorovic R, Zhao J, Gross ML, Rogan EG, Cavalieri EL. Catechol estrogen conjugates and DNA adducts in the kidney of male Syrian golden hamsters treated with 4-hydroxyestradiol: potential biomarkers for estrogen-initiated cancer. Carcinogenesis. 2001;22(3):489–497. - PubMed
Publication types
MeSH terms
Substances
Grants and funding
LinkOut - more resources
Full Text Sources
Miscellaneous
