. 2010 Sep 10;87(3):325-40.
doi: 10.1016/j.ajhg.2010.07.021.

BOOST: A fast approach to detecting gene-gene interactions in genome-wide case-control studies

Affiliations

BOOST: A fast approach to detecting gene-gene interactions in genome-wide case-control studies

Xiang Wan et al. Am J Hum Genet. .

Abstract

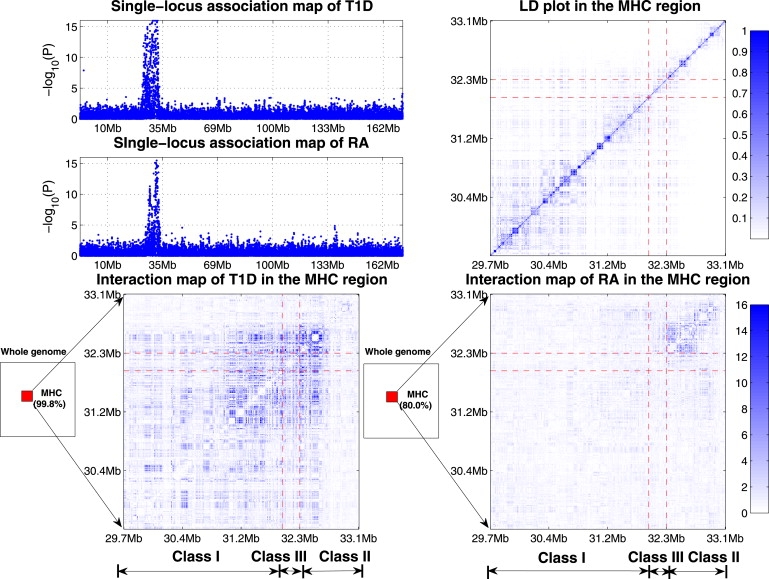
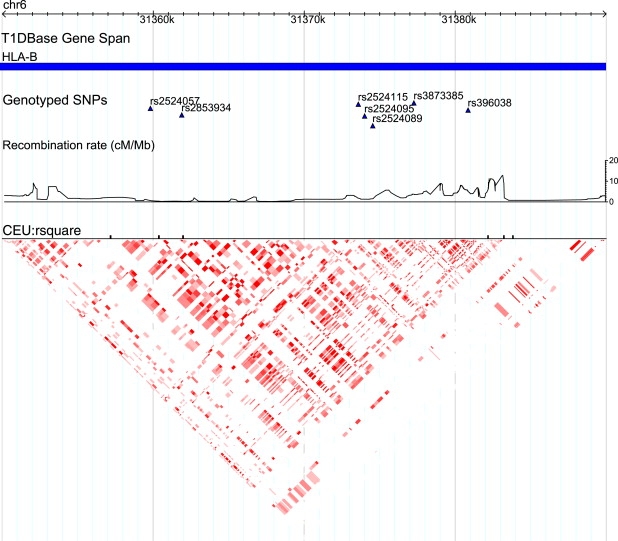
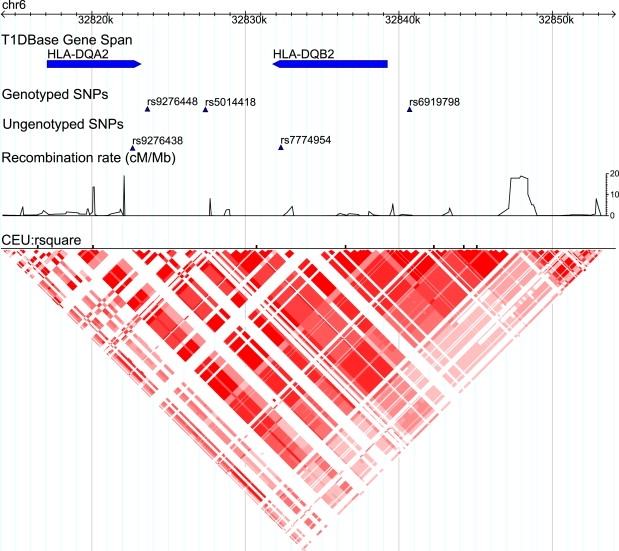
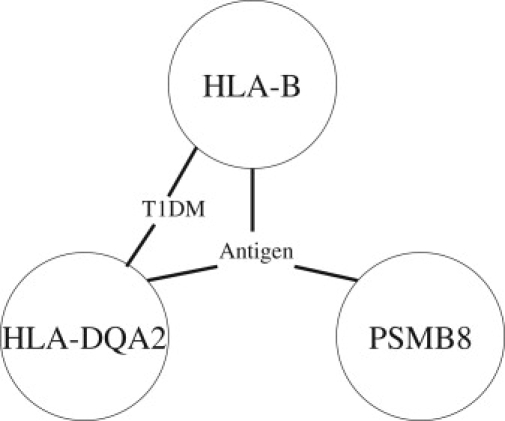
Gene-gene interactions have long been recognized to be fundamentally important for understanding genetic causes of complex disease traits. At present, identifying gene-gene interactions from genome-wide case-control studies is computationally and methodologically challenging. In this paper, we introduce a simple but powerful method, named "BOolean Operation-based Screening and Testing" (BOOST). For the discovery of unknown gene-gene interactions that underlie complex diseases, BOOST allows examination of all pairwise interactions in genome-wide case-control studies in a remarkably fast manner. We have carried out interaction analyses on seven data sets from the Wellcome Trust Case Control Consortium (WTCCC). Each analysis took less than 60 hr to completely evaluate all pairs of roughly 360,000 SNPs on a standard 3.0 GHz desktop with 4G memory running the Windows XP system. The interaction patterns identified from the type 1 diabetes data set display significant difference from those identified from the rheumatoid arthritis data set, although both data sets share a very similar hit region in the WTCCC report. BOOST has also identified some disease-associated interactions between genes in the major histocompatibility complex region in the type 1 diabetes data set. We believe that our method can serve as a computationally and statistically useful tool in the coming era of large-scale interaction mapping in genome-wide case-control studies.


Figures

Figure 1
Figure 1
KSA Performance in Simulation (A) The LD (measured by r2) pattern of simulated data from the Hapmap data. To show the block structure clearly, we show only the LD of the first 500 SNPs here. The LD block structure of all 2000 SNPs is very similar. (B) Comparison of the values 2(L^SL^KSA) and 2(L^SL^H) based on KSA and log-linear models. KSA overestimation 2(L^SL^H)2(L^SL^KSA) is illustrated here. For the region [25, + ∞), 2(L^SL^KSA) is almost identical to 2(L^SL^H).
Figure 2
Figure 2
The Performance Comparison between BOOST and PLINK on Four Disease Models Under each parameter setting, 100 data sets are generated. Both 800 samples and 1600 samples with balanced design are simulated. The power is calculated as the proportion of the 100 data sets in which the interactions of the disease-associated SNPs are detected. The absence of bars indicates no power.
Figure 3
Figure 3
Comparison of the Type I Error Rates in Null Simulation (a) Null simulation with no LD. (b) Null simulation with LD.
Figure 4
Figure 4
Comparison between the Single-Locus Association Mapping and the Interaction Mapping for T1D and RA Top-left panel: Single-locus association mapping of T1D and RA. These two share a very similar hit region in chromosome 6. Top-right panel: The LD map of the MHC region in control samples. Bottom panel: Genome-wide interaction mapping of T1D and RA. 99.8% of T1D interactions and 80.0% of RA interactions are in the MHC region. Strong interaction effects widely exist between genes in and across the MHC class I, II, and III in T1D, whereas most significant interactions of RA involve only loci closely placed in the MHC class II region (The p values are truncated at p = 1.0 × 10⁻¹⁶).
Figure 5
Figure 5
The 31350k–31390k Region of Chromosome 6 HLA-B in the MHC class I is located in this region. The recombination rate and LD plot from HapMap show that a block structure exists from 31360k to 31380k. This region is mapped through the SNPs rs2524057, rs2853934, rs2524115, rs396038, rs3873385, rs2524095, and rs2524089. The SNPs rs2524095 and rs2524089 are involved in the interactions with the 32930k–32960k region shown in Figure S2.
Figure 6
Figure 6
The 32810k–32860k Region of Chromosome 6 HLA-DQA2 and HLA-DQB2 in the MHC class II reside in this region. The recombination rate and LD plot from HapMap show that a block structure exists from 32820k to 32847k. This region is mapped through the genotyped SNPs rs9276448, rs5014418, and rs6919798. The ungenotyped SNPs rs9276438 and rs7774954 reside in HLA-DQA2 and HLA-DQB2, respectively. They are in strong LD with those genotyped SNPs.
Figure 7
Figure 7
Potential Pathways Involving HLA_B, HLA_DQA2, and PSMB8 T1DM represents the type 1 diabetes mellitus pathway. Antigen represents the antigen processing and presentation pathway.

References

    1. Bateson W., Mendel G. Cambridge University Press; Cambridge: 1909. Mendel's Principles of Heredity.
    1. Phillips P.C. Epistasis—the essential role of gene interactions in the structure and evolution of genetic systems. Nat. Rev. Genet. 2008;9:855–867. - PMC - PubMed
    1. Fisher R.A. The correlations between relatives on the supposition of mendelian inheritance. Philosophical Transactions of the Royal Society of Edinburgh. 1918;52:399–433.
    1. Cordell H.J. Detecting gene-gene interactions that underlie human diseases. Nat. Rev. Genet. 2009;10:392–404. - PMC - PubMed
    1. Ritchie M.D., Hahn L.W., Roodi N., Bailey L.R., Dupont W.D., Parl F.F., Moore J.H. Multifactor-dimensionality reduction reveals high-order interactions among estrogen-metabolism genes in sporadic breast cancer. Am. J. Hum. Genet. 2001;69:138–147. - PMC - PubMed

Publication types

LinkOut - more resources