. 2010 Sep 17;142(6):857-67.
doi: 10.1016/j.cell.2010.08.014.

Iron-export ferroxidase activity of β-amyloid precursor protein is inhibited by zinc in Alzheimer's disease

Affiliations

Iron-export ferroxidase activity of β-amyloid precursor protein is inhibited by zinc in Alzheimer's disease

James A Duce et al. Cell. .

Abstract

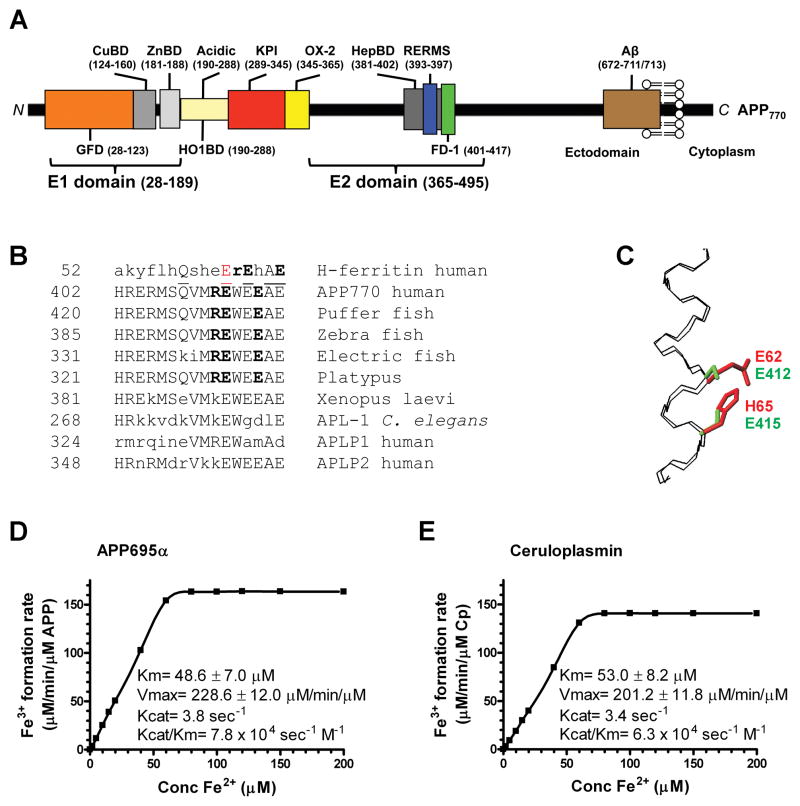
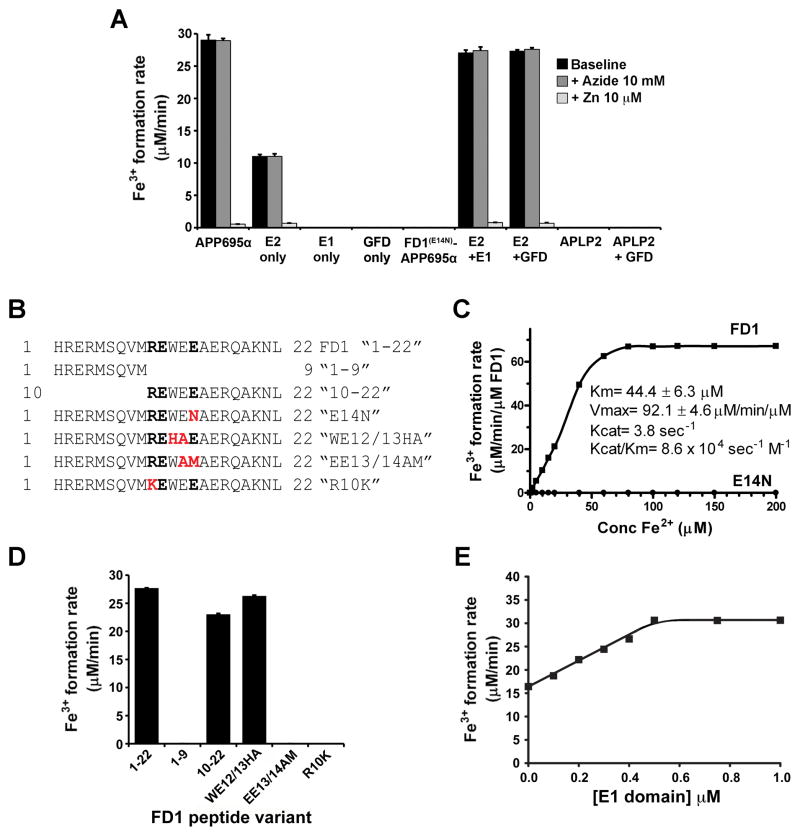
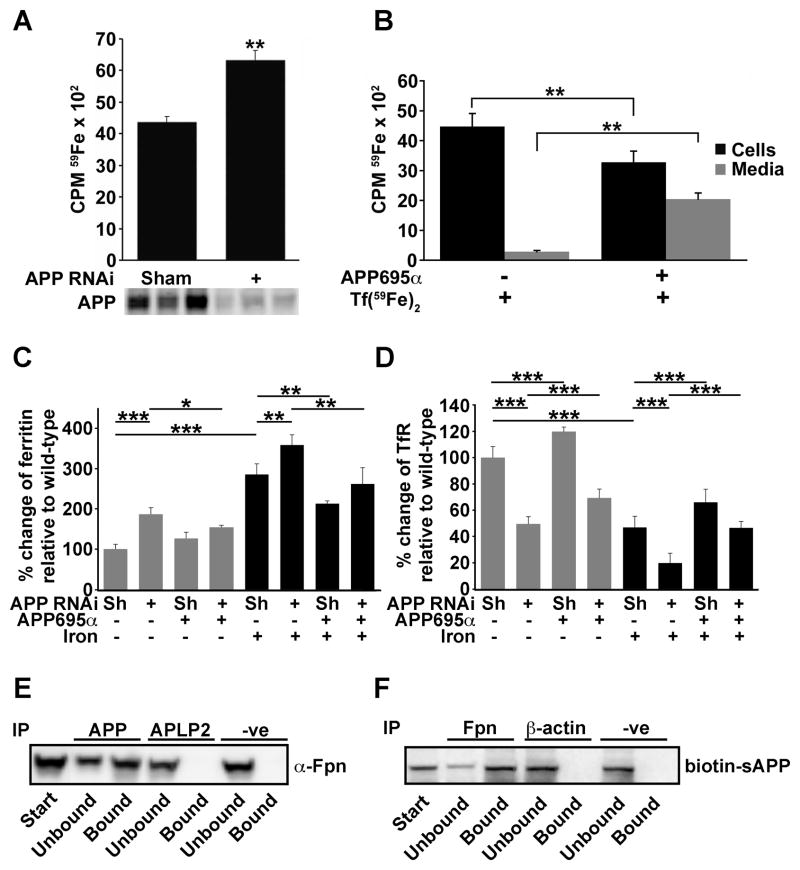
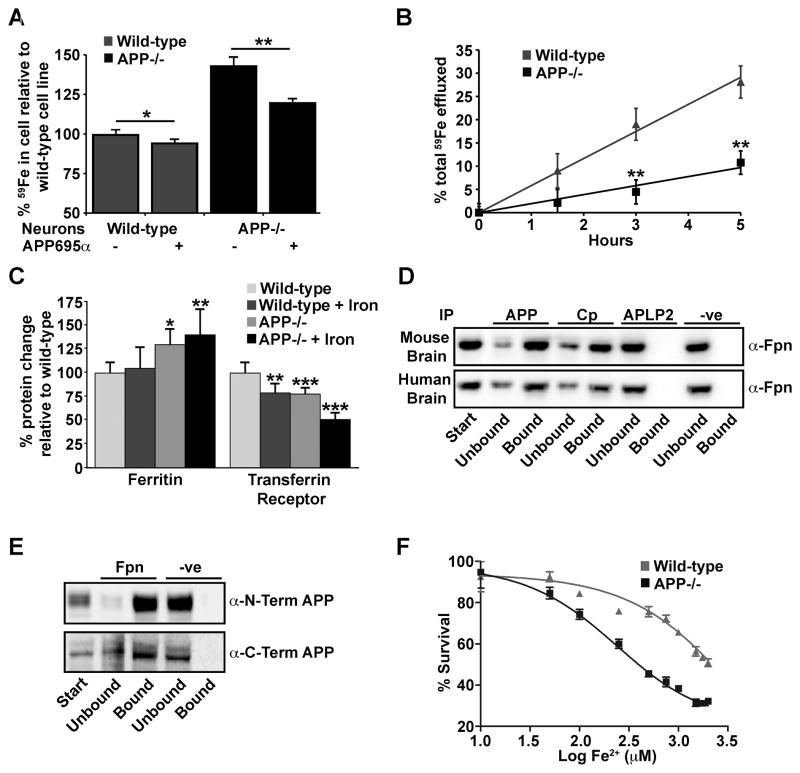
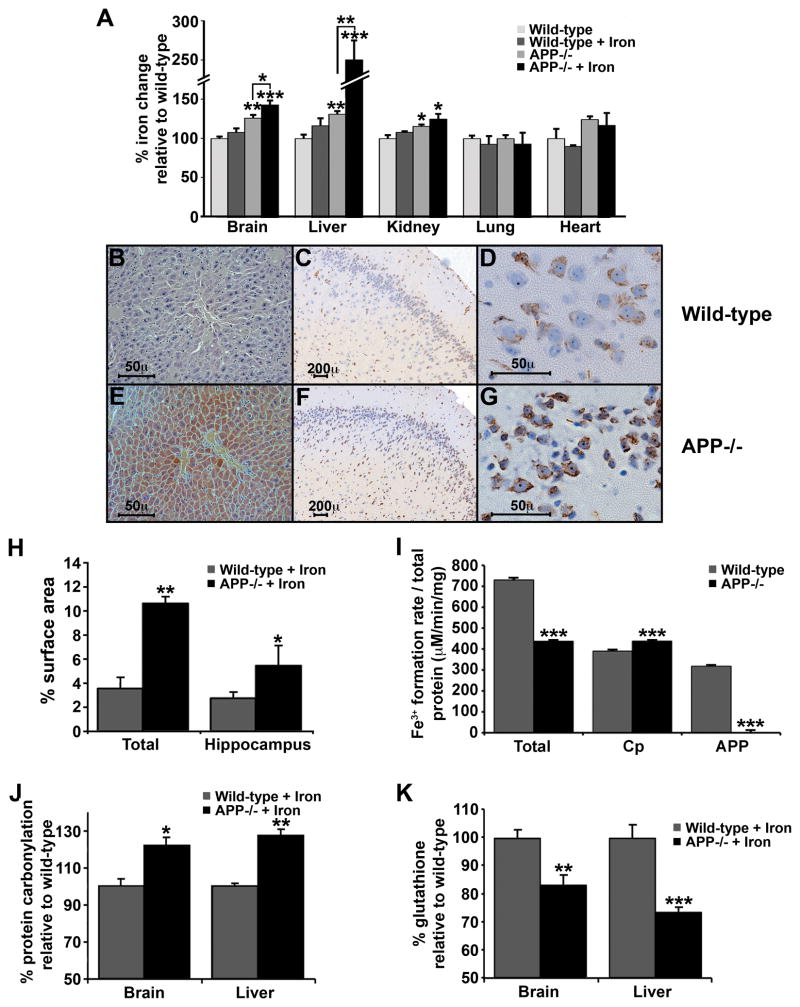
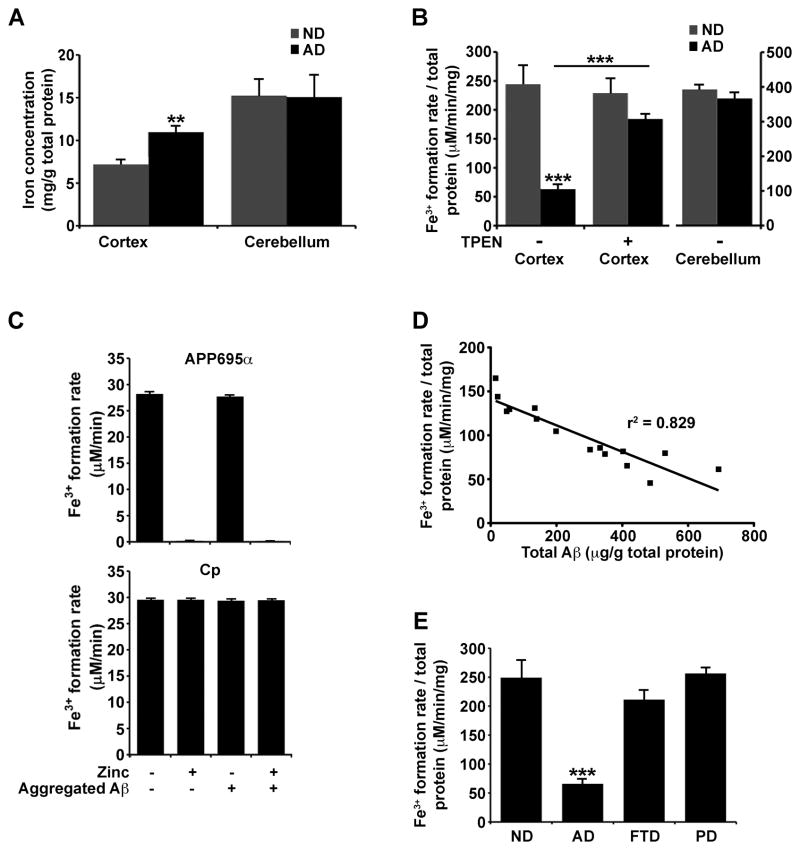
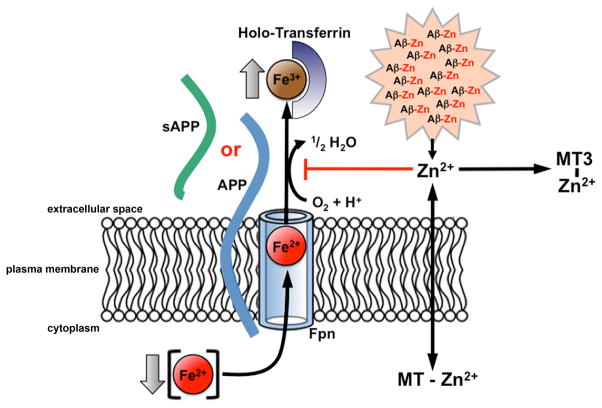
Alzheimer's Disease (AD) is complicated by pro-oxidant intraneuronal Fe(2+) elevation as well as extracellular Zn(2+) accumulation within amyloid plaque. We found that the AD β-amyloid protein precursor (APP) possesses ferroxidase activity mediated by a conserved H-ferritin-like active site, which is inhibited specifically by Zn(2+). Like ceruloplasmin, APP catalytically oxidizes Fe(2+), loads Fe(3+) into transferrin, and has a major interaction with ferroportin in HEK293T cells (that lack ceruloplasmin) and in human cortical tissue. Ablation of APP in HEK293T cells and primary neurons induces marked iron retention, whereas increasing APP695 promotes iron export. Unlike normal mice, APP(-/-) mice are vulnerable to dietary iron exposure, which causes Fe(2+) accumulation and oxidative stress in cortical neurons. Paralleling iron accumulation, APP ferroxidase activity in AD postmortem neocortex is inhibited by endogenous Zn(2+), which we demonstrate can originate from Zn(2+)-laden amyloid aggregates and correlates with Aβ burden. Abnormal exchange of cortical zinc may link amyloid pathology with neuronal iron accumulation in AD.


Figures

Figure 1
Figure 1. Characterization of APP695α ferroxidase activity
A, Schematic of APP domains. The APP770 isoform is shown, APP751 lacks the OX-2 domain, and APP695 lacks both OX-2 and Kunitz protease inhibitor (KPI) domains. CuBD= copper binding domain, ZnBD= zinc binding domain. B, Sequence homologies for the REXXE motif. A sole match for the REXXE motif (in bold) of H-ferritin is at residues 411–415 of human APP770, commencing 5 residues downstream from the RERMS neurotrophic motif (Ninomiya et al., 1993). This is an evolutionarily-conserved motif not present in either human APLP1 or APLP2. A consensus alignment of three glutamate residues and the ferroxidase active site of H-ferritin is underlined. The first glutamate of the REWEE motif of APP could be aligned with Glu62 of H-ferritin (in red), which is part of the ferroxidase catalytic site (Lawson et al., 1989; Toussaint et al., 2007) although this forces the REXXE motifs of the proteins two residues out of register. C, An overlay of the backbone atoms (N, Cα, C) of residues 52–67 of the known H-ferritin active site (Lawson et al., 1991) (PDB accession no. 1FHA) with the putative ferroxidase site within residues 402–417 of APP695 (Wang and Ha, 2004) (1rw6) (RMSD 0.4 Å). The Fe coordinating residues of H-ferritin, E62 and H65 (shown in red) overlap with the corresponding residues E412 and E415 that make up the putative ferroxidase site of APP (shown in green), based upon the sequence alignment in C. D & E, Kinetic values of Fe3+ formation from Fe2+ monitored by incorporation into transferrin, indicated within the graphs, were calculated for each protein (200 nM) incubated with various concentrations of Fe2+ at pH 7.2 to reflect the normal pH of brain interstitial space, where apo-transferrin is abundant (Visser et al., 2004). Cp values are in close agreement with the original reports (Osaki, 1966). Data are means± SEM, n= 3 replicates, typical of 3 experiments. See also Figure S1.
Figure 2
Figure 2. Domains important to APP ferroxidase activity and its inhibition by Zn2+
A, Activities of the E2 fragment of APP ± GFD-containing fragments compared to APP695α FD1(E14N)-APPα and APLP2α in HBS, pH7.2. Effects of ferroxidase inhibitors NaN3 (10 mM) for Cp, and Zn2+ (10 μM) for H-ferritin, are shown. FD1(E14N)-APP695α has the mutation in the REXXE motif shown in Figure 2B, C. B, Sequences of FD1 and derived peptides used to map the active site of APP695α. The REXXE motif is in bold, and the substitution site in red. The last 3 peptides have substitutions in the putative active site that represent the homologous sequences of H-ferritin, APLP1 and APLP2, respectively. C, Ferroxidase activities of a 22-residue peptide containing the REXXE consensus motif of APP (“FD1”, see B) and the same peptide where the REWEE sequence is substituted with REWEN (“E14N”, see B). D, Ferroxidase activity of FD1 is specific to the REXXE motif. Activity is retained upon deleting the first 9 residues (containing the RERMS motif), and when the H-ferritin REXXE consensus motif is substituted into the peptide (WE12/13HA). Activity is eliminated by substitution of the APLP1 (EE13/14AM) and APLP2 (R10K) sequence, which disrupt the REXXE consensus sequence. All peptides were 0.5 μM. E, Ferroxidase activity of the E2 domain of APP (0.5 μM) is potentiated by the E1 domain in a concentration-dependent manner up to a 1:1 stoichiometry. Values are means ± SEM, n= 3 replicates, typical of 3 experiments. See also Figure S1.
Figure 3
Figure 3. APP promotes iron release, lowers the labile iron pool and interacts with ferroportin in HEK293T cells
A, Iron flux was measured after incorporation of Tf(59Fe)2. APP RNAi (vs non-specific scrambled RNAi, “sham”) induces cellular 59Fe retention. Suppression of APP, in triplicate, was confirmed by western blot (22C11). B, APP695α (2 μM) added to the media promotes 59Fe export over 6h. C & D, Western blot (as shown in Figure S2B) quantification: APP RNAi increased ferritin (to ≈ 200%) and decreased TfR levels (to ≈ 50%), while APP695α partially reversed these effects. Additional iron (Fe(NH4)2(SO4)2,10 μM) raised the baseline ferritin and lowered the TfR, but the effect of adding or subtracting APP was similar. Sh = “sham”, non-specific scrambled RNAi. E, Interaction of APP with ferroportin using anti-Fpn for detection and anti-N-terminal APP for immunoprecipitation of HEK293T cells treated with iron (10 μM). No interaction with APLP2 confirmed specificity to APP. Non-specific rabbit IgG was used as a control (“-ve”). F, Biotin-labelled APP695α, when added to the media of HEK293T cells treated with Fe(NH4)2(SO4)2 (10 μM), is immunoprecipitated from the cell homogenate with anti-Fpn antibody. Data are means ± SEM of n=3. *= p<0.05, **= p<0.01, ***= p<0.001; A & B analysed by 2-tailed t-tests, C & D by ANOVA + Dunnet’s tests. See also Figure S2.
Figure 4
Figure 4. Intracellular iron accumulates in APP−/− neurons
A, APP−/−; primary neurons treated with Tf(59Fe)2 retain more 59Fe after 12 h than cells from WT controls. APP695α (2 μM) promotes 59Fe export into the media after 12 h from both WT and APP−/−; neurons. In APP−/−; neurons this reduces intracellular iron to approach WT levels. B, 59Fe media efflux is decreased for APP−/−; compared to WT primary neurons. Data are 59Fe counts in media expressed as a fraction of the total in culture. C, Western blot (see Figure S3D) quantification of ferritin and TfR in primary neuronal cultures from WT and APP−/−; matched controls treated ± Fe(NH4)2(SO4)2 (75 μM). Differences in APP−/−; cells are consistent with increased retention of iron. D, APP and Cp co-immunoprecipitate with ferroportin from human and mouse brain, but not APLP2. E, Determination that membrane-bound full-length APP interacts with ferroportin using APP detection antibodies for both the N- and C-terminal ends of the protein from membrane lysate of human brain immunoprecipitated by anti-Fpn antibody. F, APP−/−; neurons incubated with increasing concentrations of Fe(NH4)2(SO4)2 are more susceptible to iron toxicity, measured by CCK-8 cell viability assay, than WT neurons. Data are means ± SEM, n=3, *= p<0.05, **= p<0.01, ***= p<0.001, A - C analysed by 2-tailed t- tests, D by ANOVA + Dunnet’s test compared to WT. See also Figures S3 and S4.
Figure 5
Figure 5. Dietary iron challenge increases tissue iron in APP−/− but not normal mice
A, 12 month old APP−/−; mice accumulate iron within brain (≈125%), liver (≈130%) and kidney (≈115%) tissue compared to WT matched controls. Iron levels were further increased in brain (≈140%) and liver (≈250%) of APP−/−; mice fed a high iron diet for 8 days, which did not alter iron levels in WT matched controls. B–G, Labile redox-active iron detected by modified Perl’s staining in hepatocytes (B, E) and cortical neurons (C–D & F–G) from APP−/−; (E–G) and WT matched controls (B–D) fed a high iron diet. H, Computer-assisted quantification of modified Perl’s-stained surface area of brain sections from mice fed on a high iron diet (n=4 mice, average of 3 sections each), indicates that APP−/−; mice have significantly more redox-active iron positive cells per hemisphere, and in the hippocampus, compared to WT. I, Ferroxidase activity in brain from APP−/−; mice is decreased compared to WT matched controls. Cp activity is determined after treatment of the tissue with Zn2+ to inhibit the activity of APP. APP activity is determined after treatment of the tissue with NaN3 to inhibit the activity of Cp. J–K, In accord with increased redox-active iron in liver and brain from APP−/−; mice, significantly increased protein carbonylation occurs in APP−/−; mice fed on a high iron diet (J) and decreased glutathione in APP−/−; ± high iron diet (K). Data are means ± SEM, n=4, *= p<0.05, **= p<0.01, ***= p<0.001, A analysed by ANOVA + Dunnet’s test compared to WT, H-K by 2-tailed t-tests. See also Figure S4 and Table S1.
Figure 6
Figure 6. Decreased cortical APP ferroxidase activity in Alzheimer’s Disease
A, AD cortical tissue accumulates iron compared to age-matched non-demented (ND) samples. Iron levels were not changed in pathologically unaffected cerebellum from the same subjects. B, APP-specific ferroxidase activity is decreased in AD cortical tissue (≈75%) but not in cerebellum, consistent with the pattern of iron accumulation in A. Chelating Zn2+ from the tissue with TPEN restores the APP ferroxidase activity in AD sample to levels comparable to ND cortex. C, Both free Zn2+, as well as Zn2+ dissociating from washed Zn2+:Aβ1–42 aggregates, inhibit APP695α ferroxidase activity but not Cp activity. D, Decrease in APP-specific ferroxidase activity correlates with increased Aβ content in AD cortical tissue (p<0.0001, r2= 0.829). E, APP ferroxidase activity is not changed in cortical tissue from non-β-amyloid burdened neurodegenerative diseases such as frontotemporal dementia and Parkinson’s disease. A–C & E, Data are means ±SEM, n=8, **= p<0.01, ***= p<0.001 by 2-tailed t-tests. See also Figure S1. See also Figure S5 and Table S2.
Figure 7
Figure 7. Model for the role of APP in cellular iron export and its inhibition in Alzheimer's disease
Fpn transports Fe2+ from the cytosol across the plasma membrane. Fe2+ is then converted to Fe3+ by a membrane-bound or soluble ferroxidase such as Cp or APP (shown). The absence of the ferroxidase results in decreased iron release into the extracellular space, as Fe2+ is unable to be converted into Fe3+. APP ferroxidase is inhibited by extracellular Zn2+ (Figures 2A & 6B), which can exchange from Aβ:Zn2+ aggregates (Figure 6D). Free Zn2+ is normally buffered by the presence of ligands such as metallothioneins (including metallothionein III in the extracellular space), which are lost in AD (Uchida et al., 1991). Loss of metallothioneins and other Zn2+ buffers may lie upstream in amyloid pathology, APP ferroxidase inhibition and neuronal iron accumulation in AD. See also Figure S6.

References

    1. Adlard PA, Cherny RA, Finkelstein DI, Gautier E, Robb E, Cortes M, Volitakis I, Liu X, Smith JP, Perez K, et al. Rapid restoration of cognition in Alzheimer’s transgenic mice with 8-hydroxy quinoline analogs is associated with decreased interstitial Abeta. Neuron. 2008;59:43–55. - PubMed
    1. Bakker GR, Boyer RF. Iron incorporation into apoferritin. The role of apoferritin as a ferroxidase. J Biol Chem. 1986;261:13182–13185. - PubMed
    1. Bartzokis G, Mintz J, Sultzer D, Marx P, Herzberg JS, Phelan CK, Marder SR. In vivo MR evaluation of age-related increases in brain iron. AJNR Am J Neuroradiol. 1994a;15:1129–1138. - PMC - PubMed
    1. Bartzokis G, Sultzer D, Mintz J, Holt LE, Marx P, Phelan CK, Marder SR. In vivo evaluation of brain iron in Alzheimer’s disease and normal subjects using MRI. Biol Psychiatry. 1994b;35:480–487. - PubMed
    1. Bartzokis G, Tishler TA. MRI evaluation of basal ganglia ferritin iron and neurotoxicity in Alzheimer’s and Huntingon’s disease. Cell Mol Biol (Noisy-le-grand) 2000;46:821–833. - PubMed

Publication types