. 2010 Sep 14;19(3):389-401.
doi: 10.1016/j.devcel.2010.08.004.

Atypical cadherins Dachsous and Fat control dynamics of noncentrosomal microtubules in planar cell polarity

Affiliations

Atypical cadherins Dachsous and Fat control dynamics of noncentrosomal microtubules in planar cell polarity

Toshiyuki Harumoto et al. Dev Cell. .

Abstract

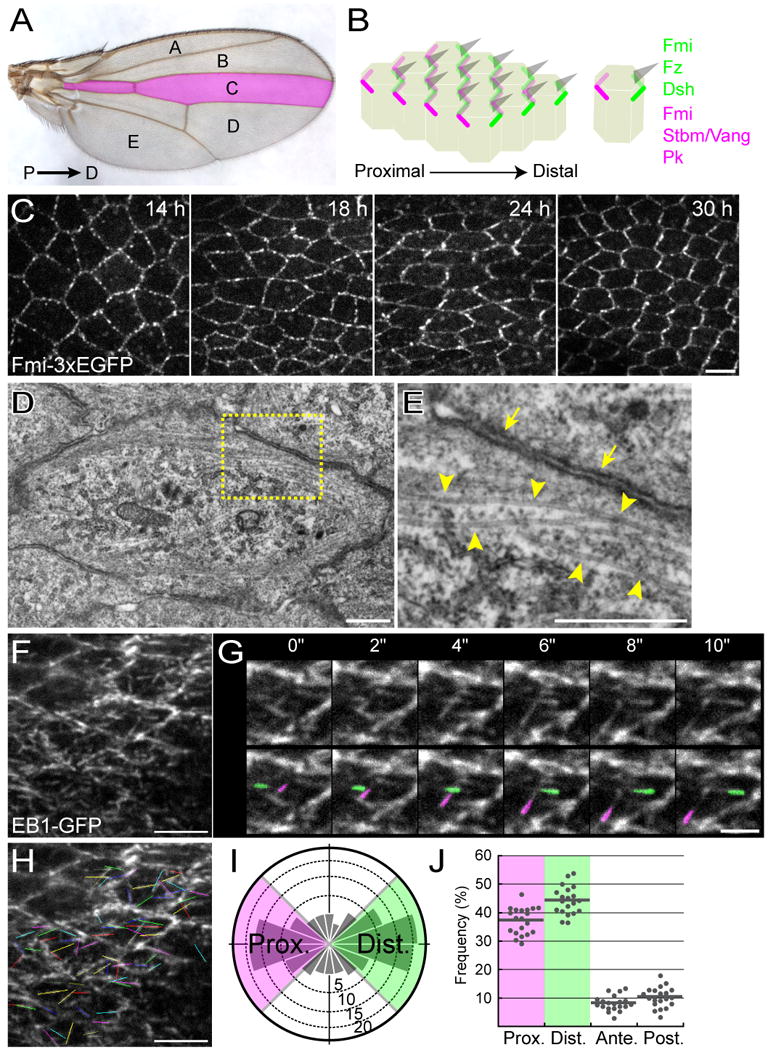
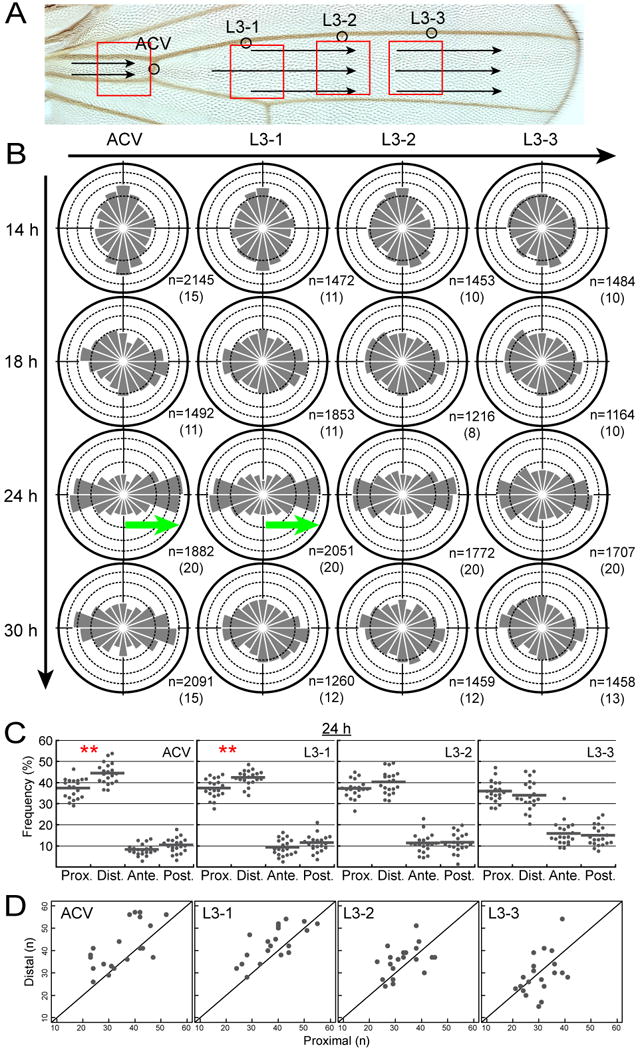
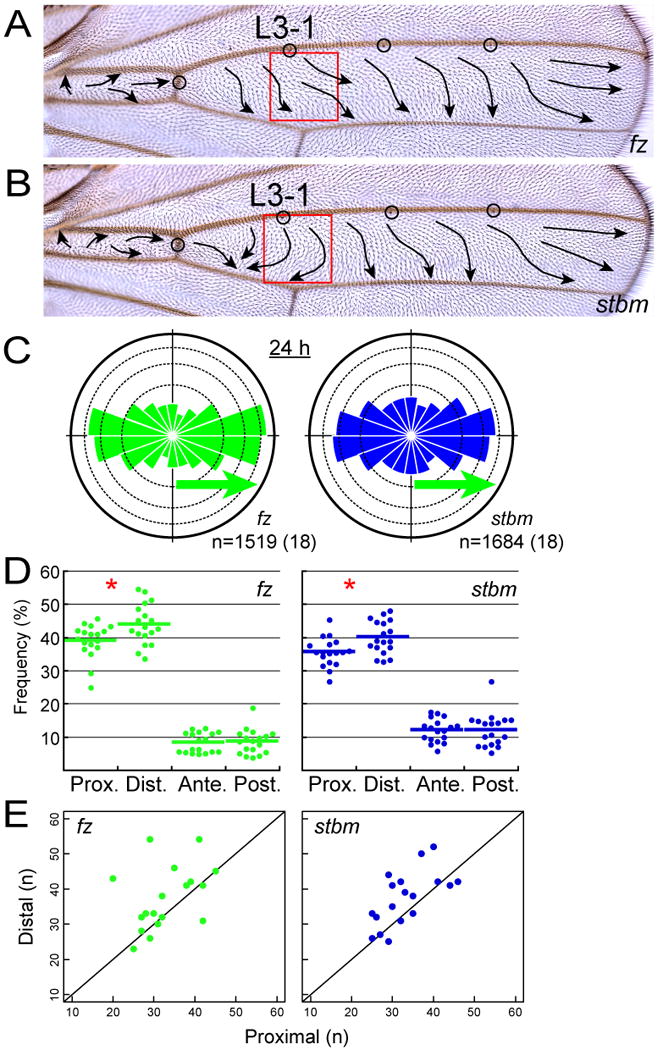
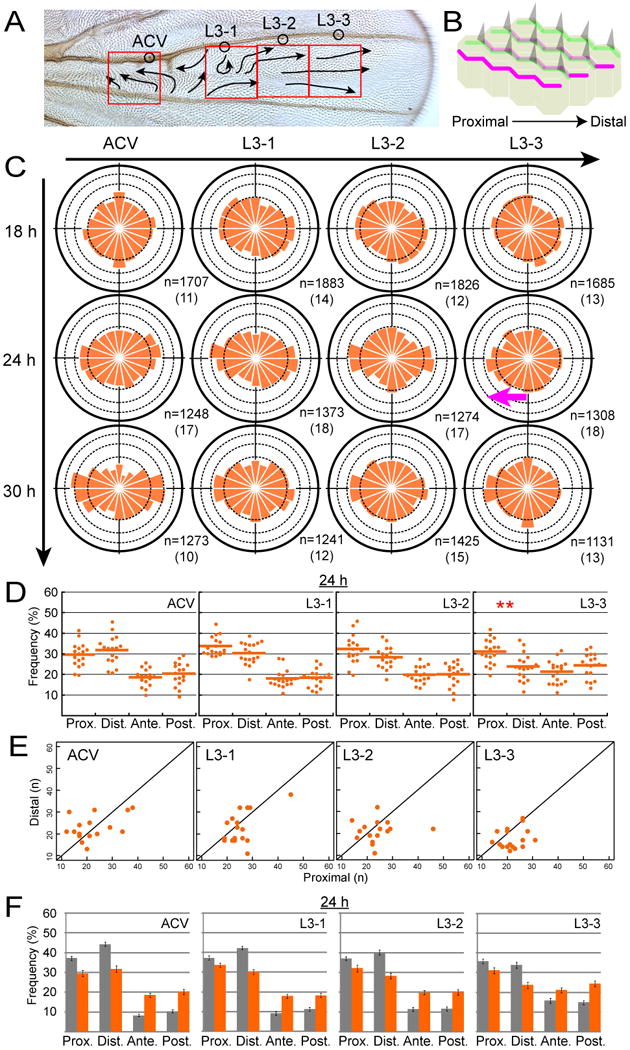
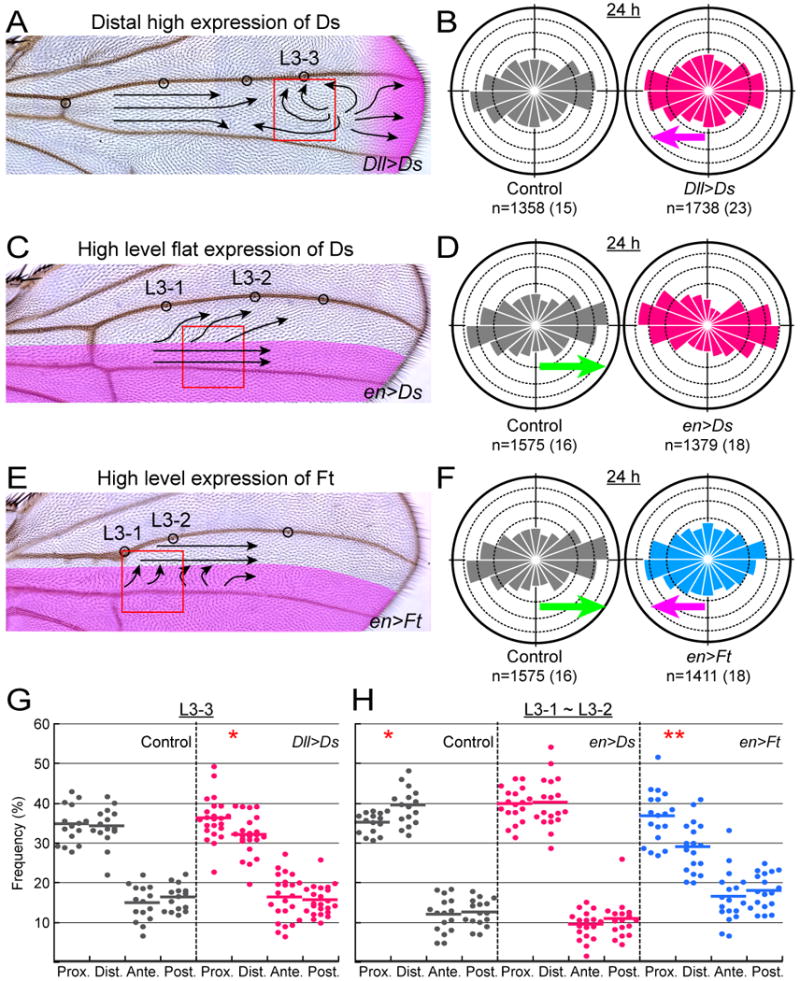
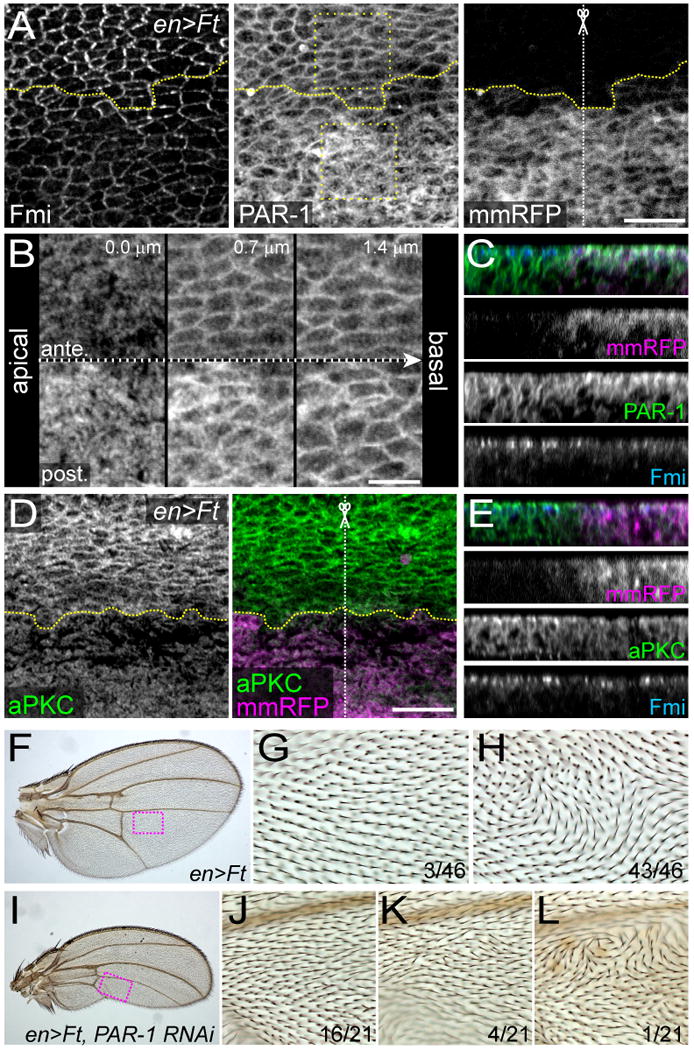
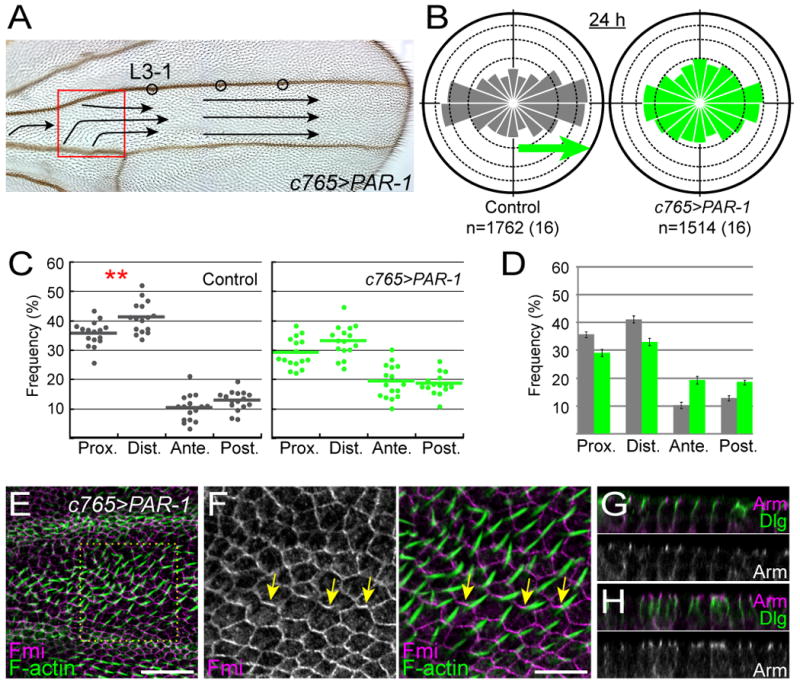
How global organ asymmetry and individual cell polarity are connected to each other is a central question in studying planar cell polarity (PCP). In the Drosophila wing, which develops PCP along its proximal-distal (P-D) axis, we previously proposed that the core PCP mediator Frizzled redistributes distally in a microtubule (MT)-dependent manner. Here, we performed organ-wide analysis of MT dynamics by introducing quantitative in vivo imaging. We observed MTs aligning along the P-D axis at the onset of redistribution and a small but significant excess of + ends-distal MTs in the proximal region of the wing. This characteristic alignment and asymmetry of MT growth was controlled by atypical cadherins Dachsous (Ds) and Fat (Ft). Furthermore, the action of Ft was mediated in part by PAR-1. All these data support the idea that the active reorientation of MT growth adjusts cell polarity along the organ axis.


Figures

Figure 1
Figure 1. Subcellular localization of core members, P-D oriented MTs, and tracking growing ends of the MTs
(A) Dorsal view of the adult wing. In this and all subsequent figures, distal is to the right and anterior is at the top. Indicated are regions A-E, which are demarcated by veins and wing margins. The region C, which was mostly observed in this study, is colored in magenta. (B) Diagrams of pupal wing epidermal cells just after the onset of prehair formation at 30-33 h after puparium formation (APF). Fmi: Flamingo; Fz: Frizzled; Dsh: Dishevelled; Stbm/Vang: Strabismus/Van Gogh; and Pk: Prickle. All of the wing hairs (gray wedges) are generated at distal cell vertexes and point distally. (C) Time-line and temporal dynamics of Fmi-3×EGFP localization around L3-1 in the region C. The “zigzag” pattern of Fmi is most coherent at 30 h APF, just prior to the onset of hair formation. All of the relevant genotypes in this and subsequent figures are described in Supplements. (D and E) EM images of a plane at the level of the adherens junction (AJ) at 24 h APF. A high-power image of the boxed area is shown in “E.” (E) Electron-dense domains (yellow arrows) correspond to the AJ, and arrowheads indicate P-D-oriented microtubules (MTs). (F and G) L3-1 location (see Figure 2A) in the dorsal wing epidermis that expressed EB1-GFP (F) and images of consecutive time points at 2-sec intervals (G) at 24 h APF. In “G,” the top images were duplicated in the bottom ones, and examples of the EB1-GFP comets were painted green and magenta in the latter. (H-J) Tracking EB1-GFP comets and statistical analysis. Movements of the comets in “F” were tracked (H), and the directional distribution of the comets is shown as a rose diagram composed of 18 bins of 20° each (I). The area of each bin represents the comets in that bin as a percentage of the total population of the comets tracked, and concentric circles are drawn with 5% increments between them. When we examined the directional preference, we compared values of the distal quadrants (-45°∼45°; green in I and J) with those of the proximal ones (135°∼225°; magenta in I and J). Each datum dot corresponds to the percentage of comets in each quadrant at a single observation point, and short horizontal bars are the means. Bar scales: 5 μm (C, F, and H), 500 nm (D and E), and 2 μm (G).
Figure 2
Figure 2. Spatiotemporal dynamics of MTs in the wild-type wing
(A) Indicated by red boxes are 4 distinct locations in the wild-type wing where MT growth was observed. The image of the adult wing was used for clarity (see images of pupal wings in Figure S1A). 4 campaniform sensilla were used as spatial landmarks (circles). Arrows represent the polarity of wing hairs on the dorsal surface. (B) The directional distribution of MT growth. The horizontal axis on the top represents the P-D position; and the vertical on the left, the pupal age. Green arrows indicate statistically significant asymmetry of MT polarity with an excess of + end-distal MTs at 24 h APF. Indicated at the lower right-hand corner of each diagram is the number of EB1-GFP comets tracked and that of the wing from which the data were collected (in parentheses). (C) Statistical analysis of the directional preference of the EB1-GFP comets at 24 h APF. + end-distal MTs were more abundant than + end-proximal ones at the ACV and L3-1 locations [**: p < 0.01; Wilcoxon signed-rank test; actual p-values were 0.003724 (ACV) and 0.004227 (L3-1)]. (D) The number of proximally shooting comets and that of distally shooting ones in each sample at each location at 24 h APF were plotted on X and Y axes, respectively, together with a 45 degree line.
Figure 3
Figure 3. The directional preference of growing MTs in fz and stbm mutant wing cells
(A and B) Adult wings of fz (A) and stbm (B) mutants. Arrows represent the polarity of wing hairs on the dorsal surface. Red boxes indicate the locations where MT growth was observed. (C) The directional distribution of MT growth in fz (green) and stbm (blue) mutants (see the legends of Figure 2B). (D) The directional preference at 24 h APF [*: p < 0.05; Wilcoxon signed-rank test; actual p-values are 0.03574 (fz) and 0.019 (stbm)]. (E) Number of proximally shooting comets and that of distally shooting ones in each genotype at L3-1 at 24 h APF (see the legends of Figure 2D).
Figure 4
Figure 4. Abnormal MT dynamics in ds mutant wing
(A) Red boxes indicate 4 distinct locations observed in a ds mutant wing (see also Figure S1B). Arrows represent the hair polarity on the dorsal surface. (B) Diagram of a small region in a ds mutant wing just after the onset of prehair formation. See details in the text. (C) The directional distribution of MT growth in ds mutants. The magenta arrow indicates statistically significant asymmetry of MT polarity that was opposite to that in the wild-type wing at 24 h APF (Figure 2B; other explanations are in its legend). (D) The directional preference at 24 h APF. + end-proximal MTs were more abundant than + end-distal ones at the distal L3-3 location (**: p < 0.01; Wilcoxon signed-rank test; actual p-value is 0.00599). (E) Number of proximally shooting comets and that of distally shooting ones in each sample at each location at 24 h APF (see the Figure 2D legend). (F) Comparisons of percentage of + ends in each direction between the wild type (gray bars) and ds mutant (orange bars) at 24 h APF. Each error bar indicates SEM. The directional preference was significantly different between the wild-type and the ds mutant wing at all of the locations examined (p < 0.001; Pearson's χ2 test).
Figure 5
Figure 5. Effects of ds or ft misexpression on MT dynamics
(A, C, and E) Adult wings of animals in which ds or ft was misexpressed or overexpressed. The presumptive expression domains are shaded in magenta (see also Movies S5 and S6). Arrows represent the hair polarity on the dorsal surface. (A) ds was ectopically expressed in cells along the distal wing margin. (C and E) ds and ft, respectively were overexpressed in the posterior compartment. (B, D, and F) MT growth at 24 h APF in the control animals (gray) and in the animals in “A,” “C,” and “E” (red and cyan, respectively). Green arrows, magenta arrows, and numbers below the diagrams are as explained in the legends of Figures 2B and 4C. (G and H) The directional preference of EB1-GFP comets at 24 h APF at location L3-3 (G; red box in “A”) and at the location between L3-1 and L3-2 (H; red boxes in “C” and “E”). Gray datum points were collected from the control animals, whereas red and cyan points were from animals in “A,” ”C,” and “E,” respectively. Statistical significance of the directional preference between proximally oriented MTs and distally oriented MTs is indicated with asterisks (*: p < 0.05; **: p < 0.01; Wilcoxon signed-rank test). Actual p-values were 0.01614 (Dll>Ds in “G”), 0.01286 (control in “H”), and 0.003745 (en>Ft in “H”).
Figure 6
Figure 6. Subcellular localization of PAR-1 in the wild-type wing
(A) Specificity of our PAR-1 antibody in the wild-type wing (31 h APF). Cortical and cytoplasmic signals (green) were hardly detected in the clone that expressed par-1 dsRNA and membrane-bound monomeric Cherry (mCherry-CAAX: magenta). (B-E) ACV regions (B and C) and L3-1 regions (D and E) of 18 h, 24 h, and 30 h APF wings that were doubly stained for PAR-1 (B and D, and green in “C” and “E”) and Fmi (magenta in “C” and “E”). Arrowheads represent developing ACVs (B) and campaniform sensillum L3-1s (D). Dotted lines trace L3 and L4 veins. (C and E) High-power images of Fmi and PAR-1 patterns in the box in “B” and “D” are shown. On the right are the merged images of Fmi (magenta) and PAR-1 (green). (F) A vertical section of a 30 h APF wing. Fmi (left), PAR-1 (middle), and a merged image of Fmi (magenta) and PAR-1 (green). Apical is at the top. Bar scales: 10 μm (A), 20 μm (B and D), and 5 μm (C and E).
Figure 7
Figure 7. PAR-1 subcellular localization was altered when Ft was overexpressed
(A-C) ft was overexpressed in the posterior compartment (en>Ft) and stained for Fmi (left) and PAR-1 (middle) at 24 h APF (A). The posterior compartment was labeled by mmRFP (right), and the dotted yellow lines demarcate borders of the expression domain. All panels are projections of 5 optical sections. High-power images of the 2 boxed regions in anterior and posterior compartments are shown on the top (ante.) and at the bottom (post.), respectively, in “B.” The images were taken from apical (left) to basal (right) at 0.7-μm intervals. The z section along the dotted white line marked by the scissor in “A” is shown in “C,” which includes a merge and single-channel images for mmRFP (magenta), PAR-1 (green), and Fmi (blue). (D and E) An en>Ft wing at 24 h APF was stained for aPKC (green in “D” and “E”) and Fmi (blue in “E”). The expression domain was labeled by mmRFP (magenta), and dotted yellow lines demarcate the borders of the domains. The z section along the dotted white line in “D” is shown in “E,” which includes a merge and single-channel images for mmRFP (magenta), aPKC (green), and Fmi (blue). Bar scales: 10 μm (A and D), 5 μm (B). (F-L) Adult wings of animals in which ft (F-H) or ft and PAR-1 dsRNA (I-L) were overexpressed in the posterior compartment of the wing. ft overexpression caused a highly-penetrant polarity phenotype (G and H; boxed region in “F”), which was suppressed when par-1 was knocked down (J-L; boxed region in “I”). All of the 21 knocked-down wings examined had a similar size.
Figure 8
Figure 8. par-1 overexpression disrupted PCP and the MT dynamics at the proximal location
(A) The red box indicates the location where we observed MT growth in a par-1-overexpressing wing (c765>PAR-1). Arrows represent the hair polarity in region C (see Figure 1A) on the dorsal surface. (B) The directional distribution of MT growth at 24 h APF in the control wing (gray) and the par-1-overexpressing wing (green). The green arrow and numbers below the diagrams are as explained in the legends of Figure 2B. (C) The directional preference of the EB1-GFP comets at 24 h APF, at a location between ACV and L3-1 in the control wing (gray data points), and at the boxed location in “A” in the par-1-overexpressing wing (green datum points). Statistical significance of differences between proximally oriented MTs and distally oriented MTs are indicated with an asterisk (**: p < 0.01; Wilcoxon signed-rank test). The actual p-value was 0.004855 (control). (D) Statistical comparisons of frequency of + ends in each direction between the wild-type (gray) and the par-1-overexpressing wing (green) at 24 h APF. Each error bar indicates SEM. The directional preference was significantly different between the wild-type and the par-1-overexpressing wing (p < 0.001; Pearson's χ2 test). (E and F) 33 h APF wing that was doubly stained for Fmi (magenta) and F-actin (green). The imaged location corresponds to the red box in “A.” High-power image of the box in “E” is highlighted in “F.” Fmi was tightly associated with cell boundaries including A/P boundaries (arrows). Wing hairs (green) were generated at cell vertexes that were connected to those Fmi-mislocalized A/P boundaries. (G and H) Vertical sections of 33 h APF wings of a control animal (G) and a par-1-overexpressing one (H) that were doubly labeled for apically localized Armadillo (Arm; magenta) and basolaterally located Discs-large (Dlg; green). Apical is at the top. Bar scales: 20 μm (E) and 10 μm (F).

Similar articles

Cited by

References

    1. Adler PN, Charlton J, Liu J. Mutations in the cadherin superfamily member gene dachsous cause a tissue polarity phenotype by altering frizzled signaling. Development. 1998;125:959–968. - PubMed
    1. Adler PN. Planar signaling and morphogenesis in Drosophila. Dev Cell. 2002;2:525–535. - PubMed
    1. Axelrod JD. Progress and challenges in understanding planar cell polarity signaling. Semin Cell Dev Biol. 2009;20:964–971. - PubMed
    1. Baena-López LA, Baonza A, García-Bellido A. The orientation of cell divisions determines the shape of Drosophila organs. Curr Biol. 2005;15:1640–1644. - PubMed
    1. Bayraktar J, Zygmunt D, Carthew RW. Par-1 kinase establishes cell polarity and functions in Notch signaling in the Drosophila embryo. J Cell Sci. 2006;119:711–721. - PubMed

Publication types

MeSH terms