Comparative Study
. 2010 Nov 15;19(22):4437-52.
doi: 10.1093/hmg/ddq370. Epub 2010 Sep 2.

Dissecting the role of the mitochondrial chaperone mortalin in Parkinson's disease: functional impact of disease-related variants on mitochondrial homeostasis

Affiliations
Comparative Study

Dissecting the role of the mitochondrial chaperone mortalin in Parkinson's disease: functional impact of disease-related variants on mitochondrial homeostasis

Lena F Burbulla et al. Hum Mol Genet. .

Abstract

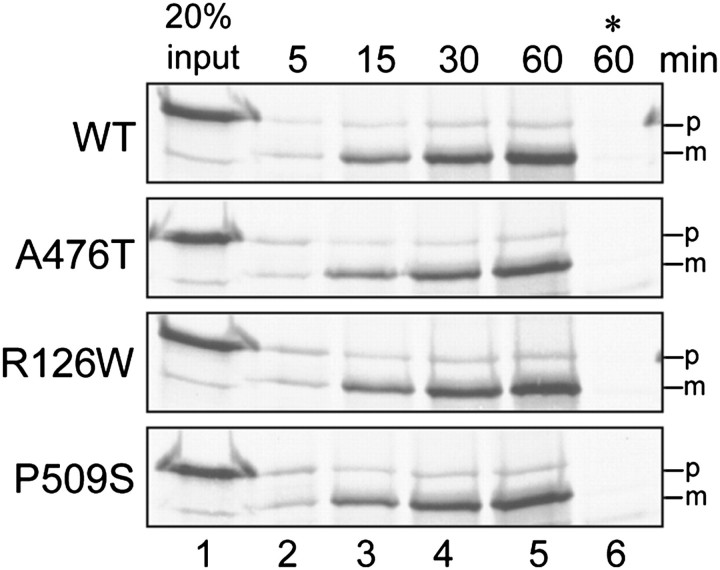
The mitochondrial chaperone mortalin has been linked to neurodegeneration in Parkinson's disease (PD) based on reduced protein levels in affected brain regions of PD patients and its interaction with the PD-associated protein DJ-1. Recently, two amino acid exchanges in the ATPase domain (R126W) and the substrate-binding domain (P509S) of mortalin were identified in Spanish PD patients. Here, we identified a separate and novel variant (A476T) in the substrate-binding domain of mortalin in German PD patients. To define a potential role as a susceptibility factor in PD, we characterized the functions of all three variants in different cellular models. In vitro import assays revealed normal targeting of all mortalin variants. In neuronal and non-neuronal human cell lines, the disease-associated variants caused a mitochondrial phenotype of increased reactive oxygen species and reduced mitochondrial membrane potential, which were exacerbated upon proteolytic stress. These functional impairments correspond with characteristic alterations of the mitochondrial network in cells overexpressing mutant mortalin compared with wild-type (wt), which were confirmed in fibroblasts from a carrier of the A476T variant. In line with a loss of function hypothesis, knockdown of mortalin in human cells caused impaired mitochondrial function that was rescued by wt mortalin, but not by the variants. Our genetic and functional studies of novel disease-associated variants in the mortalin gene define a loss of mortalin function, which causes impaired mitochondrial function and dynamics. Our results support the role of this mitochondrial chaperone in neurodegeneration and underscore the concept of impaired mitochondrial protein quality control in PD.


Figures

Figure 1.
Figure 1.
Identification of mortalin as a DJ-1-interacting protein using a proteomic approach. We performed a GST pull-down assay on lysates from dopaminergic neuroblastoma cells (SK-N-BE) with recombinant DJ-1-GST fusion proteins including wt protein and three known point variants (M26I, E64D and L166P). Samples were analyzed by 8% SDS–PAGE and stained with Coomassie. The first lane represents a protein marker with kilodalton weights indicated on the left followed by the different DJ-1 constructs used as a bait (lane 2: wt DJ-1; lane 3: E64D mutant DJ-1; lane 4: M26I mutant DJ-1; lane 5: L166P mutant DJ-1). Subsequent LC-ESI-MS/MS analyses identified mortalin as a specific binding partner of DJ-1 (red box).
Figure 2.
Figure 2.
Localization, interspecies comparison and homology modeling of three novel mortalin variants. (A) A schematic diagram of the various protein domains of the mitochondrially targeted protein mortalin. The variants A476T and P509S are located in the substrate-binding domain, whereas the R126W variant affects the ATPase domain. All of the variants affect highly conserved regions of the protein. (BD) An interspecies comparison of the amino acid sequence of the mortalin protein. (E) Homology modeling based on the predicted structure of mortalin as derived from the homology to Geobacillus kaustophilus HTA426 was assessed by SWISS-MODEL (http://swissmodel.expasy.org). The arrows indicate the sites of the variants.
Figure 3.
Figure 3.
In vitro import of wt mortalin and its variants into mitochondria. Radiolabeled precursors of mortalin or its variants were incubated for the indicated time with mitochondria isolated from HeLa cells. Reaction mixtures were incubated at 30°C in the absence (lanes 2–5) or presence (lane 6; asterisk) of CCCP. At the end of the import reactions, proteinase K was added and mitochondria were reisolated by centrifugation before their analysis by SDS–PAGE and autoradiography. The precursor and mature forms of the protein are labeled as p and m, respectively.
Figure 4.
Figure 4.
Effects of mortalin on mitochondrial homeostasis under basal conditions and under the induction of proteasomal stress in SH-SY5Y cells. (A) Measurement of MitoSOX Red fluorescence signal of untreated SH-SY5Y cells and paradigm with the treatment of the proteasome stressor MG-132. The results were normalized to the empty vector control. An increased fluorescence signal correlates with a higher amount of ROS. The left panel shows ROS levels under basal conditions. Overexpression of wt mortalin indicates a significantly lower production of ROS compared with the overexpression of P509S mortalin or vector control (P< 0.05). The right panel shows ROS levels under conditions of proteasomal stress induced by MG-132. Compared with cells overexpressing one of the mortalin variants or the vector control, cells overexpressing wt mortalin exhibited significantly reduced ROS levels (P< 0.01 for A476T mortalin; P< 0.001 for R126W mortalin, P509S mortalin and control). All experiments were performed in duplicate and repeated at least three times. Data are presented as means ± SD. (B) Measurement of TMRE fluorescence signal of untreated as well as MG-132-treated SH-SY5Y cells to monitor the MMP by flow cytometry. Analysis of TMRE fluorescence demonstrated an improved MMP in cells overexpressing wt mortalin compared with cells expressing one of the mortalin variants or the vector control (P< 0.01; left panel). After treatment with the proteasomal inhibitor MG-132, cells overexpressing one of the variants or the vector control demonstrated significant alterations of MMP compared with cells overexpressing wt mortalin (P< 0.05; right panel). Data are indicated as mean ± SD of three independent experiments.
Figure 5.
Figure 5.
Effect of mortalin on mitochondrial morphology in SH-SY5Y cells. (A) Mitochondrial morphology in living SH-SY5Y cells transiently cotransfected with Mito-DsRed (red) and wt mortalin, its disease-associated variants or the empty vector in the ratio 1:4 was analyzed by live-cell-imaging microscopy (Cell Observer Z1, Zeiss) at 37°C using ApoTome® optical slides with 0.240–0.300 µm z-stacks. Forty-eight hours after cotransfection, nuclei were stained with Hoechst 33342 (blue). The respective stainings were merged and mitochondria were analyzed using Image J 1.41o software for area, perimeter, major and minor axes based on binary images, which only have two possible values (black/white) for each pixel. On the basis of these parameters, the AR of a single mitochondrion and its FF were calculated. (B) Mitochondrial branching as indicated by the FF was significantly increased in SH-SY5Y cells cotransfected with Mito-DsRed and wt mortalin compared with cotransfection with empty vector or one of the mortalin variants (P< 0.001; left panel). Mitochondrial length as indicated by the AR was significantly increased in cells overexpressing wt mortalin compared with R126W mortalin or P509S mortalin (P< 0.001) as well as in cells transfected with the empty vector (P< 0.05; right panel). Images from 222 individual cells were analyzed from three independent experiments. Data are presented as mean ± SE of three independent experiments.
Figure 6.
Figure 6.
Expression levels of mortalin in a knockdown model. (A) WB analysis of the mortalin siRNA-mediated knockdown effect on endogenous mortalin (lane 2) as well as retransfection levels of recombinant wt (lane 3), A476T (lane 4), R126W (lane 5) and P509S (lane 6) mortalin following siRNA treatment. The effect of the addition of mortalin siRNA per se was controlled by the use of an unmodified non-targeting control siRNA (lane 1). We used an antibody against mortalin to control for expression levels of endogenous mortalin, and anti-β-actin was used as loading control. (B) Densitometric analysis of the WB shown in (A). In respect to cells treated with control siRNA (lane 1), downregulation of mortalin by use of siRNA and retransfection of the empty vector resulted in 57% of control levels (lane 2). The rescue effect observed by retransfection of wt mortalin (lane 3) or one of the mortalin variants (lanes 4–6) was between 81 and 97% compared with cells treated with control siRNA.
Figure 7.
Figure 7.
Effect of downregulation of mortalin on mitochondrial function. (A) ROS production as indicated by the level of MitoSOX Red fluorescence signal was significantly increased in mortalin siRNA-transfected HEK293 cells relative to control siRNA-transfected cells (P< 0.01). Transfection of siRNA-treated cells with wt mortalin showed a complete rescue of this mitochondrial phenotype. Rescue with A476T mortalin was partially achieved, whereas transfection with R126W or P509S mortalin variants failed to restore this mitochondrial phenotype (P< 0.05 compared with control siRNA-treated cells). (B) Measurement of TMRE red fluorescence signal revealed a significant increase of altered MMP in HEK293 cells transfected with mortalin siRNA compared with control (P< 0.05). Restoration of this signal could be observed by transfection of wt mortalin, but not with R126W or P509S mortalin variants. Partial rescue was observed by transfection of A476T mortalin. Data are indicated as mean ± SD of three independent experiments.
Figure 8.
Figure 8.
Effect of mortalin on mitochondrial morphology in human fibroblasts. (A) Mitochondrial morphology in living human fibroblasts from a carrier of the A476T variant and a healthy sibling control were analyzed by live-cell-imaging microscopy at 37°C using ApoTome® optical slides with 0.240–0.300 z-stacks. Mitochondria were stained with 200 nm of the specific mitochondrial dye MitoTracker® green FM (green) for 15 min at 37°C; nuclei were stained with Hoechst 33342 (blue). The respective stainings were merged and mitochondria were analyzed using Image J 1.41o software for area, perimeter, major and minor axes based on binary images. The calculation of the AR and FF was done as described in Figure 5. (B) Mitochondrial branching as indicated by the FF was significantly reduced in fibroblasts from the carrier of the A476T variant in comparison with control fibroblasts (P< 0.001) (left panel). Mitochondrial length as indicated by the AR was significantly reduced in fibroblasts from the carrier of the A476T variant in comparison with control cells (right panel). Eighty-two individual cells were analyzed from three independent experiments. Data are indicated as mean ± SE of three independent experiments.

References

    1. Schiesling C., Kieper N., Seidel K., Kruger R. Review: familial Parkinson's disease—genetics, clinical phenotype and neuropathology in relation to the common sporadic form of the disease. Neuropathol. Appl. Neurobiol. 2008;34:255–271. doi:10.1111/j.1365-2990.2008.00952.x. - DOI - PubMed
    1. Simon-Sanchez J., Schulte C., Bras J.M., Sharma M., Gibbs J.R., Berg D., Paisan-Ruiz C., Lichtner P., Scholz S.W., Hernandez D.G., et al. Genome-wide association study reveals genetic risk underlying Parkinson's disease. Nat. Genet. 2009;41:1308–1312. doi:10.1038/ng.487. - DOI - PMC - PubMed
    1. Schapira A.H. Mitochondria in the aetiology and pathogenesis of Parkinson's disease. Parkinsonism Relat. Disord. 1999;5:139–143. doi:10.1016/S1353-8020(99)00029-2. - DOI - PubMed
    1. Strauss K.M., Martins L.M., Plun-Favreau H., Marx F.P., Kautzmann S., Berg D., Gasser T., Wszolek Z., Muller T., Bornemann A., et al. Loss of function mutations in the gene encoding Omi/HtrA2 in Parkinson's disease. Hum. Mol. Genet. 2005;14:2099–2111. doi:10.1093/hmg/ddi215. - DOI - PubMed
    1. Valente E.M., Salvi S., Ialongo T., Marongiu R., Elia A.E., Caputo V., Romito L., Albanese A., Dallapiccola B., Bentivoglio A.R. PINK1 mutations are associated with sporadic early-onset parkinsonism. Ann. Neurol. 2004;56:336–341. doi:10.1002/ana.20256. - DOI - PubMed

Publication types

MeSH terms