

Label-free bacterial imaging with deep-UV-laser-induced native fluorescence
- PMID: 20817797
- PMCID: PMC2976275
- DOI: 10.1128/AEM.00943-10
Label-free bacterial imaging with deep-UV-laser-induced native fluorescence
Abstract
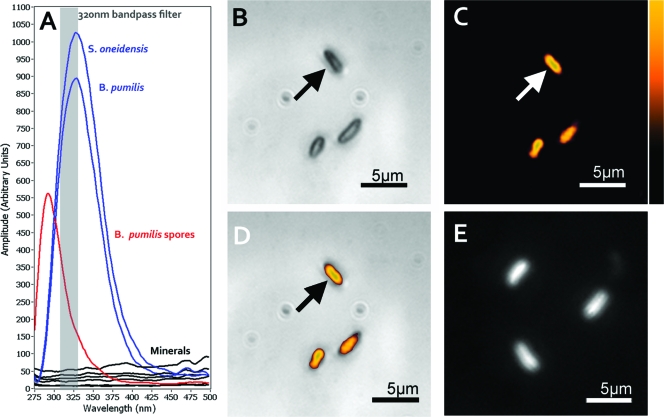
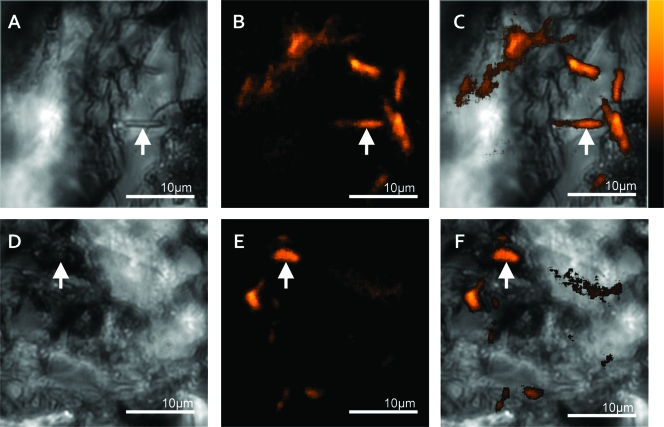
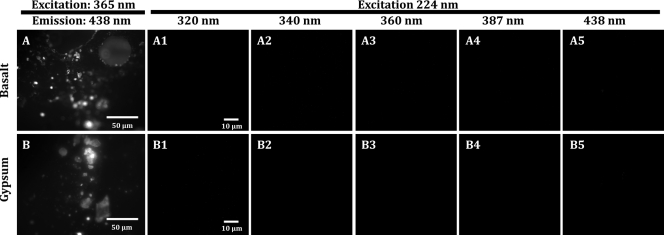
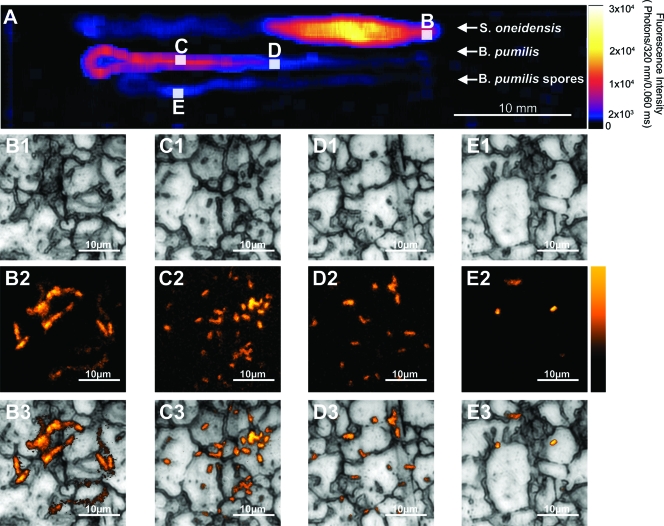
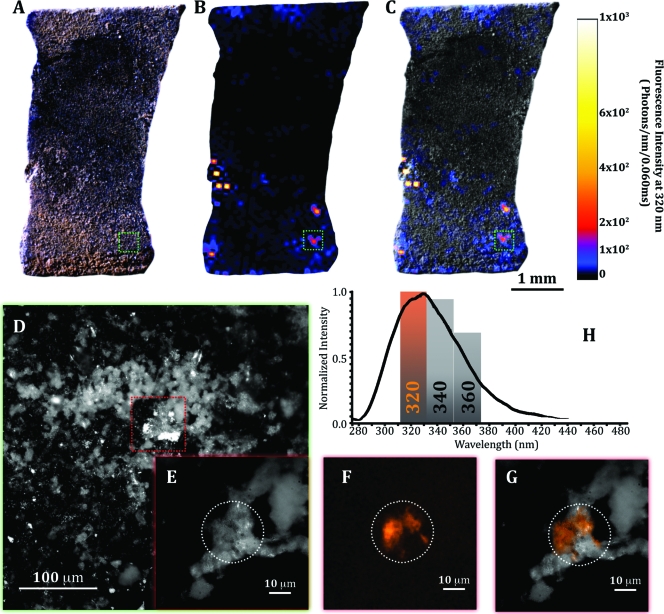
We introduce a near-real-time optical imaging method that works via the detection of the intrinsic fluorescence of life forms upon excitation by deep-UV (DUV) illumination. A DUV (<250-nm) source enables the detection of microbes in their native state on natural materials, avoiding background autofluorescence and without the need for fluorescent dyes or tags. We demonstrate that DUV-laser-induced native fluorescence can detect bacteria on opaque surfaces at spatial scales ranging from tens of centimeters to micrometers and from communities to single cells. Given exposure times of 100 μs and low excitation intensities, this technique enables rapid imaging of bacterial communities and cells without irreversible sample alteration or destruction. We also demonstrate the first noninvasive detection of bacteria on in situ-incubated environmental experimental samples from the deep ocean (Lo'ihi Seamount), showing the use of DUV native fluorescence for in situ detection in the deep biosphere and other nutrient-limited environments.
Figures
Similar articles
-
Plasmon-Enhanced Autofluorescence Imaging of Organelles in Label-Free Cells by Deep-Ultraviolet Excitation.Anal Chem. 2016 Jan 19;88(2):1407-11. doi: 10.1021/acs.analchem.5b04060. Epub 2016 Jan 4. Anal Chem. 2016. PMID: 26669415
-
Deep ultraviolet 266 nm laser excitation for flow cytometry.Cytometry A. 2024 Mar;105(3):214-221. doi: 10.1002/cyto.a.24813. Epub 2023 Dec 20. Cytometry A. 2024. PMID: 38116677
-
Deep UV autofluorescence microscopy for cell biology and tissue histology.Biol Cell. 2013 Jul;105(7):277-88. doi: 10.1111/boc.201200075. Epub 2013 Apr 26. Biol Cell. 2013. PMID: 23517500
-
Capillary electrophoresis hyphenated with UV-native-laser induced fluorescence detection (CE/UV-native-LIF).Electrophoresis. 2017 Jan;38(1):135-149. doi: 10.1002/elps.201600248. Epub 2016 Sep 5. Electrophoresis. 2017. PMID: 27445082 Review.
-
Advances in Optical Detection of Human-Associated Pathogenic Bacteria.Molecules. 2020 Nov 11;25(22):5256. doi: 10.3390/molecules25225256. Molecules. 2020. PMID: 33187331 Free PMC article. Review.
Cited by
-
Under the sea: microbial life in volcanic oceanic crust.Nat Rev Microbiol. 2011 Sep 6;9(10):703-12. doi: 10.1038/nrmicro2647. Nat Rev Microbiol. 2011. PMID: 21894169 Review.
-
The Cell and the Sum of Its Parts: Patterns of Complexity in Biosignatures as Revealed by Deep UV Raman Spectroscopy.Front Microbiol. 2019 May 14;10:679. doi: 10.3389/fmicb.2019.00679. eCollection 2019. Front Microbiol. 2019. PMID: 31156562 Free PMC article.
-
An instrument design for non-contact detection of biomolecules and minerals on Mars using fluorescence.J Biol Eng. 2014 Jul 1;8:16. doi: 10.1186/1754-1611-8-16. eCollection 2014. J Biol Eng. 2014. PMID: 25057291 Free PMC article.
-
Plasmon- and Waveguide-Coupled Fluorescence at the Ultraviolet Region.J Phys Chem C Nanomater Interfaces. 2023 Jun 29;127(25):12084-12095. doi: 10.1021/acs.jpcc.3c01231. Epub 2023 Jun 20. J Phys Chem C Nanomater Interfaces. 2023. PMID: 38274198 Free PMC article.
-
Translational rapid ultraviolet-excited sectioning tomography for whole-organ multicolor imaging with real-time molecular staining.Elife. 2022 Nov 4;11:e81015. doi: 10.7554/eLife.81015. Elife. 2022. PMID: 36331195 Free PMC article.
References
-
- Banfield, J. F., and K. H. Nealson (ed.). 1997. Geomicrobiology: interactions between microbes and minerals, p. 448. Mineralogical Society of America, Washington, DC.
-
- Barra Caracciolo, A., P. Grenni, C. Cupo, and S. Rossetti. 2005. In situ analysis of native microbial communities in complex samples with high particulate loads. FEMS Microbiol. Lett. 253:55-58. - PubMed
-
- Beech, I. B., J. A. Sunner, C. R. Arciola, and P. Cristiani. 2006. Microbially-influenced corrosion: damage to prostheses, delight for bacteria. Int. J. Artif. Organs 29:443-452. - PubMed
-
- Bennett, P., J. Rogers, and W. Choi. 2001. Silicates, silicate weathering, and microbial ecology. Geomicrobiol. J. 18:3-19.
-
- Bhartia, R., W. F. Hug, E. C. Salas, R. D. Reid, K. K. Sijapati, A. Tsapin, W. Abbey, K. H. Nealson, A. L. Lane, and P. G. Conrad. 2008. Classification of organic and biological materials with deep ultraviolet excitation. Appl. Spectrosc. 62:1070-1077. - PubMed
Publication types
MeSH terms
LinkOut - more resources
Full Text Sources
Other Literature Sources
