. 2010 Oct 1;185(7):4446-56.
doi: 10.4049/jimmunol.1001254. Epub 2010 Sep 3.

Gene expression profiles in a rabbit model of systemic lupus erythematosus autoantibody production

Affiliations

Gene expression profiles in a rabbit model of systemic lupus erythematosus autoantibody production

Geeta Rai et al. J Immunol. .

Abstract

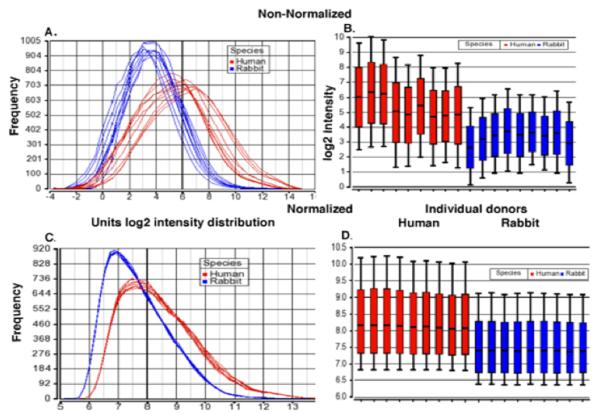
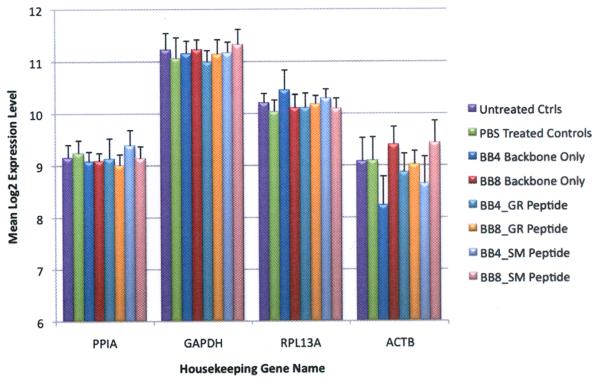
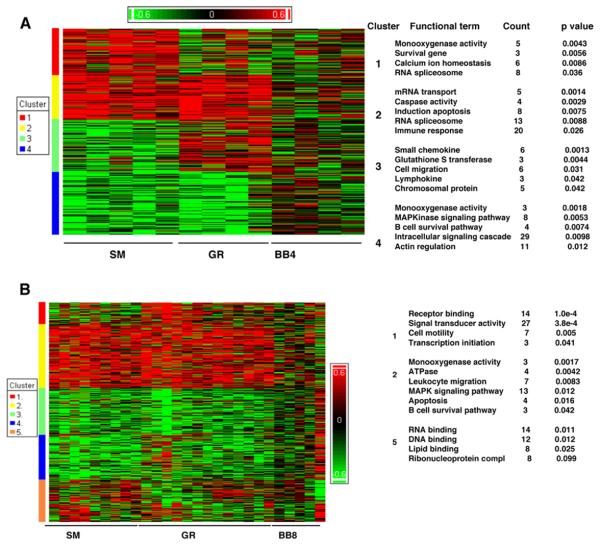
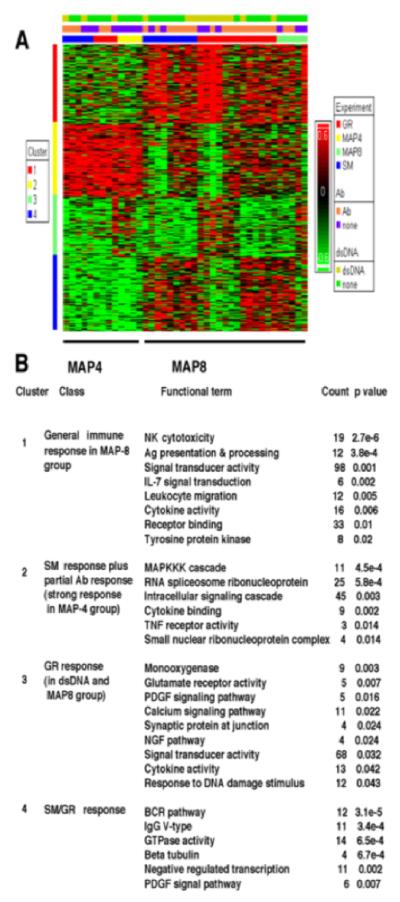
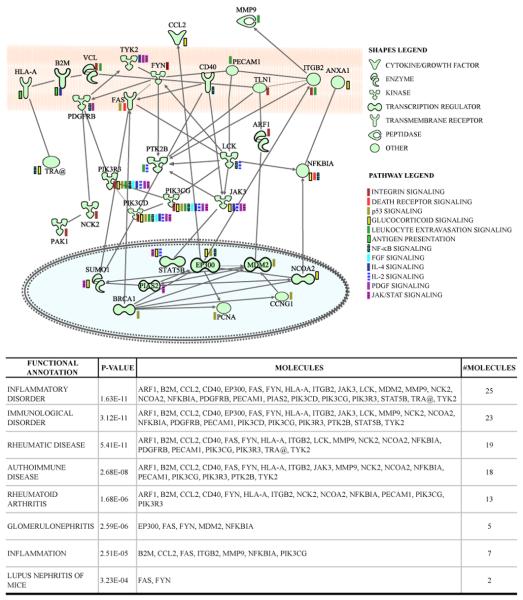
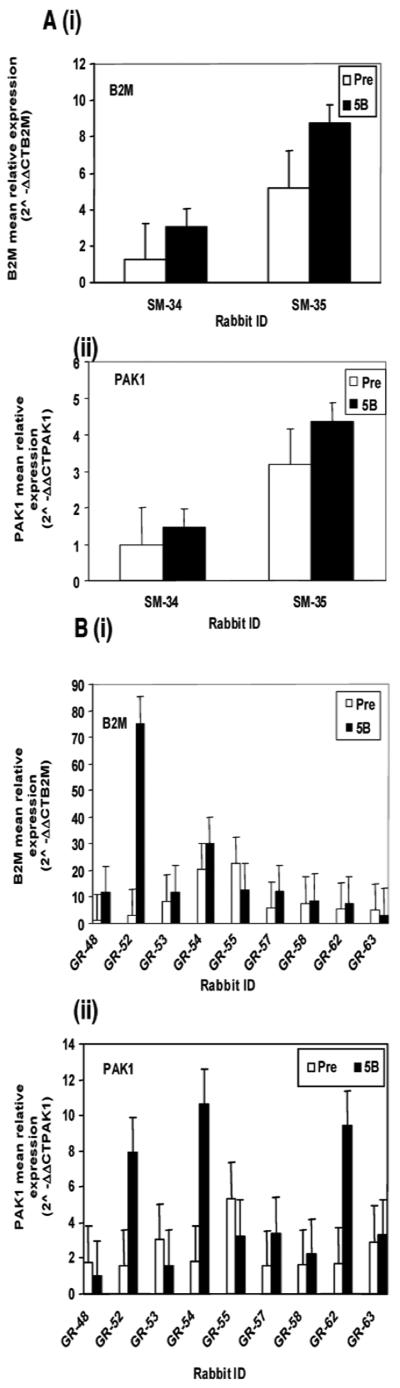
We previously reported the establishment of a rabbit (Oryctolagus cuniculus) model in which peptide immunization led to production of lupus-like autoantibodies including anti-Sm, -RNP, -SS-A, -SS-B, and -dsDNA characteristic of those produced in systemic lupus erythematosus (SLE) patients. Some neurologic symptoms in the form of seizures and nystagmus were observed. The animals used in the previous and in the current study were from a National Institute of Allergy and Infectious Diseases colony of rabbits that were pedigreed, Ig-allotype defined, but not inbred. Their genetic heterogeneity may correspond to that found among patients of a given ethnicity. We extended the information about this rabbit model by microarray-based expression profiling. We first demonstrated that human expression arrays could be used with rabbit RNA to yield information on molecular pathways. We then designed a study evaluating gene expression profiles in eight groups of control and treated rabbits (47 rabbits in total). Genes significantly upregulated in treated rabbits were associated with NK cytotoxicity, Ag presentation, leukocyte migration, cytokine activity, protein kinases, RNA spliceosomal ribonucleoproteins, intracellular signaling cascades, and glutamate receptor activity. These results link increased immune activation with upregulation of components associated with neurologic and anti-RNP responses, demonstrating the utility of the rabbit model to uncover biological pathways related to SLE-induced clinical symptoms, including neuropsychiatric lupus. Our finding of distinct gene expression patterns in rabbits that made anti-dsDNA compared with those that only made other anti-nuclear Abs should be further investigated in subsets of SLE patients with different autoantibody profiles.


Figures

FIGURE 1
FIGURE 1
Comparison of distribution of gene expression as measured with rabbit and human cRNA probes binding to human microarrays before and after dChip and within species normalization. A. and B. Non-normalized MAS5 probe set intensity distribution for log transformed gene expression of RNA isolated from 9 different PWBC samples from rabbit (blue) and 9 from human (red) on the Affymetrix huU95A array. C. and D. Following dChip summarization and within species normalization, rabbit samples average 0.7 fold dimmer. In panels B. and D., the middle lines show the median, the boxes represent 25th and 75th percentile of the data distribution, and whiskers representing 10% and 90% of the data distribution.
FIGURE 2
FIGURE 2
Average expression levels of housekeeping genes of the 8 rabbit groups studied showing consistency of the mean log2 expression levels of four housekeeping genes [PPIA (Peptidylprolyl isomerase A), GAPDH, RPL3a (ribosomal protein L13a), and ACTB]. Error bars show SEM.
FIGURE 3
FIGURE 3
MAP-4 vs MAP-8 backbones (BB) affect gene expression patterns. At p < 0.05, and at 2≤ Filter cut-off (Fc) ≤2,768 genes passed the filter. Shades of red represent upregulation, shades of green downregulation and genes are clustered by similarity. The top functional categories for each of the clusters are indicated along the side of the figures. (A) Microarray analysis of the peptide effect of MAP-4 group reveals genes in cluster 1 showing over-representation in the SM group and genes in cluster 3 over-expressed in the GR group. Cluster 2 comprises genes, with a common elevated expression pattern in both SM and GR groups and cluster 4 genes have a common decreased expression pattern in both SM and GR groups. (B) Heat map depicting peptide effect in MAP-8 group includes 224 genes commonly overexpressed in SM and GR group. Count shows the number of different genes upregulated in expression associated with each Functional term within the cluster.
FIGURE 4
FIGURE 4
Clustering of differentially expressed genes in rabbits immunized with GR and SM peptides synthesized on MAP-4 (Group 2 rabbits) or MAP-8 (Groups 1, 3, and 4) backbones (BB) or with BB alone. Differences in relative levels of gene expression (Z-score) are indicated in color, where red indicates up-regulation and green indicates down-regulation relative to that of corresponding gene expression in controls. The legend on the right refers to the set of bars across the top. The lower bar indicates whether the MAP immunogen carried SM peptide (blue), GR peptide (red), only MAP-4 BB (bright yellow) or MAP-8 BB (pale green). The center bar indicates which rabbits made some detectable autoantibody (orange) and which did not (purple) and the upper bar which animals produced anti-dsDNA (chartreuse yellow) and which did not (dark green).
FIGURE 5
FIGURE 5
Interactive pathway network of upregulated genes in anti-dsDNA positive rabbits. The shapes legend classifies the proteins found as transmembrane receptors, cytokines/growth factors, kinases, peptidases, other enzymes and transcriptional regulators. The pathway legend identifies of genes that were common to the listed pathways that were upregulated in the anti-dsDNA positive rabbits. The connecting lines indicate direct interactions among the products of these genes.
FIGURE 6
FIGURE 6
Validation of gene expression changes using real time PCR. The unit number showing relative mRNA levels in each sample was determined as a value of mRNA normalized against Peptidylprolyl isomerase A (PPIA). RT-PCR data were analyzed by using the 2−ΔΔCT method as described in (36). Results of quantitative real time PCR analyses shown in each panel were normalized relative to the lowest value set at 1. The open bars indicate expression pre-immunization (Pre) and the filled bars expression after the fifth boost (5B). Rabbit's numbers are show on the x axis. The y axis shows mean relative expression of the tested genes normalized relative to the lowest value set at 1. Increased mean relative mRNA expression of i) B2M and ii) PAK1 after the 5th boost in rabbits SM34 and SM35. B. Additional data showing increases in mean relative mRNA expression of i) B2M and ii) PAK1 in rabbits studied subsequently (31).

Similar articles

Cited by

References

    1. Moser KL, Kelly JA, Lessard CJ, Harley JB. Recent insights into the genetic basis of systemic lupus erythematosus. Genes Immun. 2009;10:373–379. - PMC - PubMed
    1. Pan Y, Sawalha AH. Epigenetic regulation and the pathogenesis of systemic lupus erythematosus. Transl. Res. 2009;153:4–10. - PubMed
    1. Jönsen A, Bengtsson AA, Nived O, Truedsson L, Sturfelt G. Gene-environment interactions in the aetiology of systemic lupus erythematosus. Autoimmunity. 2007;40:613–617. - PubMed
    1. Cohen-Solal JF, Jeganathan V, Hill L, Kawabata D, Rodriguez-Pinto D, Grimaldi C, Diamond B. Hormonal regulation of B-cell function and systemic lupus erythematosus. Lupus. 2008;17:528–532. - PubMed
    1. Werth VP. Cutaneous lupus: insights into pathogenesis and disease classification. Bull. NYU Hosp. Jt. Dis. 2007;65:200–204. - PubMed

Publication types

MeSH terms