

Shifts in the intensity of purifying selection: an analysis of genome-wide polymorphism data from two closely related yeast species
- PMID: 20817943
- PMCID: PMC2963819
- DOI: 10.1101/gr.108993.110
Shifts in the intensity of purifying selection: an analysis of genome-wide polymorphism data from two closely related yeast species
Abstract
How much does the intensity of purifying selection vary among populations and species? How uniform are the shifts in selective pressures across the genome? To address these questions, we took advantage of a recent, whole-genome polymorphism data set from two closely related species of yeast, Saccharomyces cerevisiae and S. paradoxus, paying close attention to the population structure within these species. We found that the average intensity of purifying selection on amino acid sites varies markedly among populations and between species. As expected in the presence of extensive weakly deleterious mutations, the effect of purifying selection is substantially weaker on single nucleotide polymorphisms (SNPs) segregating within populations than on SNPs fixed between population samples. Also in accordance with a Nearly Neutral model, the variation in the intensity of purifying selection across populations corresponds almost perfectly to simple measures of their effective size. As a first step toward understanding the processes generating these patterns, we sought to tease apart the relative importance of systematic, genome-wide changes in the efficacy of selection, such as those expected from demographic processes and of gene-specific changes, which may be expected after a shift in selective pressures. For that purpose, we developed a new model for the evolution of purifying selection between populations and inferred its parameters from the genome-wide data using a likelihood approach. We found that most, but not all changes seem to be explained by systematic shifts in the efficacy of selection. One population, the sake-derived strains of S. cerevisiae, however, also shows extensive gene-specific changes, plausibly associated with domestication. These findings have important implications for our understanding of purifying selection as well as for estimates of the rate of molecular adaptation in yeast and in other species.
Figures
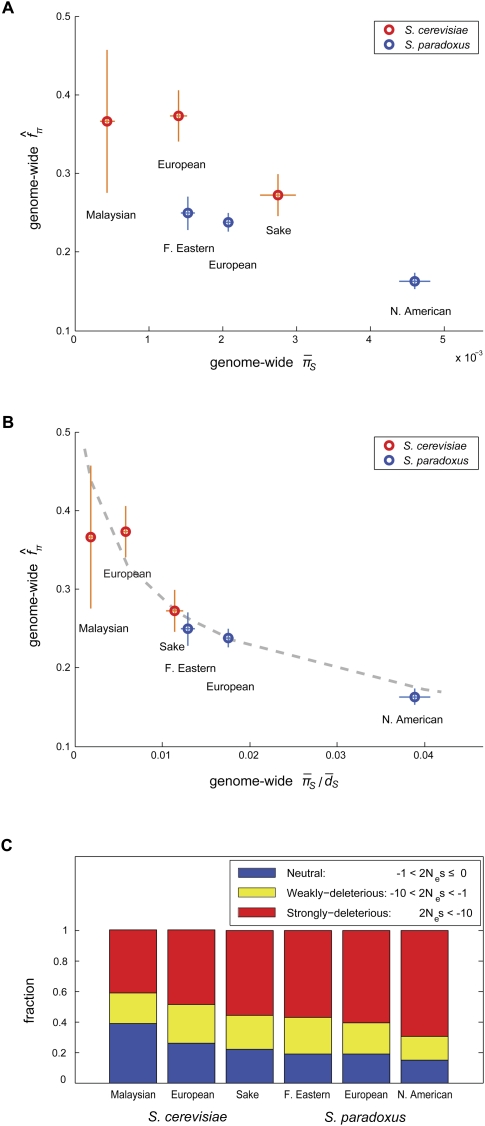
 (A) and
  (B), where
  is the average synonymous divergence (see text). Central 95th percentiles for the estimates, represented by the horizontal and vertical bars, were estimated by bootstrapping over genes. The dashed line in B shows the expected relationship between f and assuming a gamma-shaped distribution of mutational selective effects with a point mass at s = −∞ (see text and Methods). (C) Using the same distribution, the estimated fractions of effectively neutral, weakly deleterious, and strongly deleterious amino acid mutations in each population.

Similar articles
-
Population genomics of domestic and wild yeasts.Nature. 2009 Mar 19;458(7236):337-41. doi: 10.1038/nature07743. Epub 2009 Feb 11. Nature. 2009. PMID: 19212322 Free PMC article.
-
A catalog of neutral and deleterious polymorphism in yeast.PLoS Genet. 2008 Aug 29;4(8):e1000183. doi: 10.1371/journal.pgen.1000183. PLoS Genet. 2008. PMID: 18769710 Free PMC article.
-
Genome-wide survey of natural selection on functional, structural, and network properties of polymorphic sites in Saccharomyces paradoxus.Mol Biol Evol. 2011 Sep;28(9):2615-27. doi: 10.1093/molbev/msr085. Epub 2011 Apr 3. Mol Biol Evol. 2011. PMID: 21478372 Free PMC article.
-
Population genomics of yeasts: towards a comprehensive view across a broad evolutionary scale.Yeast. 2016 Mar;33(3):73-81. doi: 10.1002/yea.3142. Epub 2016 Jan 19. Yeast. 2016. PMID: 26592376 Review.
-
The genomes of fermentative Saccharomyces.C R Biol. 2011 Aug-Sep;334(8-9):687-93. doi: 10.1016/j.crvi.2011.05.019. Epub 2011 Jul 1. C R Biol. 2011. PMID: 21819951 Review.
Cited by
-
Weak selection and protein evolution.Genetics. 2012 Sep;192(1):15-31. doi: 10.1534/genetics.112.140178. Genetics. 2012. PMID: 22964835 Free PMC article. Review.
-
Weighing the evidence for adaptation at the molecular level.Trends Genet. 2011 Sep;27(9):343-9. doi: 10.1016/j.tig.2011.06.003. Epub 2011 Jul 19. Trends Genet. 2011. PMID: 21775012 Free PMC article.
-
Selection Transforms the Landscape of Genetic Variation Interacting with Hsp90.PLoS Biol. 2016 Oct 21;14(10):e2000465. doi: 10.1371/journal.pbio.2000465. eCollection 2016 Oct. PLoS Biol. 2016. PMID: 27768682 Free PMC article.
-
Rare variants in hypermutable genes underlie common morphology and growth traits in wild Saccharomyces paradoxus.Genetics. 2013 Oct;195(2):513-25. doi: 10.1534/genetics.113.155341. Epub 2013 Aug 9. Genetics. 2013. PMID: 23934881 Free PMC article.
-
Frequent adaptation and the McDonald-Kreitman test.Proc Natl Acad Sci U S A. 2013 May 21;110(21):8615-20. doi: 10.1073/pnas.1220835110. Epub 2013 May 6. Proc Natl Acad Sci U S A. 2013. PMID: 23650353 Free PMC article.
References
-
- Amos LA, van den Ent F, Lowe J 2004. Structural/functional homology between the bacterial and eukaryotic cytoskeletons. Curr Opin Cell Biol 16: 24–31 - PubMed
-
- Andolfatto P 2005. Adaptive evolution of non-coding DNA in Drosophila. Nature 437: 1149–1152 - PubMed
-
- Bennetzen JL, Hall BD 1982. Codon selection in yeast. J Biol Chem 257: 3026–3031 - PubMed
-
- Bierne N, Eyre-Walker A 2004. The genomic rate of adaptive amino acid substitution in Drosophila. Mol Biol Evol 21: 1350–1360 - PubMed
Publication types
MeSH terms
Grants and funding
LinkOut - more resources
Full Text Sources
Other Literature Sources
Molecular Biology Databases
Research Materials