. 2010 Oct;31(8):1233-41.
doi: 10.1097/MAO.0b013e3181f1ffdf.

Intracochlear recordings of electrophysiological parameters indicating cochlear damage

Affiliations

Intracochlear recordings of electrophysiological parameters indicating cochlear damage

Oliver F Adunka et al. Otol Neurotol. 2010 Oct.

Abstract

Objective: : The pathophysiologic mechanisms resulting in hearing loss during electrode implantation are largely unknown. To better understand the functional implications of electrode implantation, we recorded the effects of cochlear damage on acoustically evoked intracochlear measurements using normal-hearing gerbils.

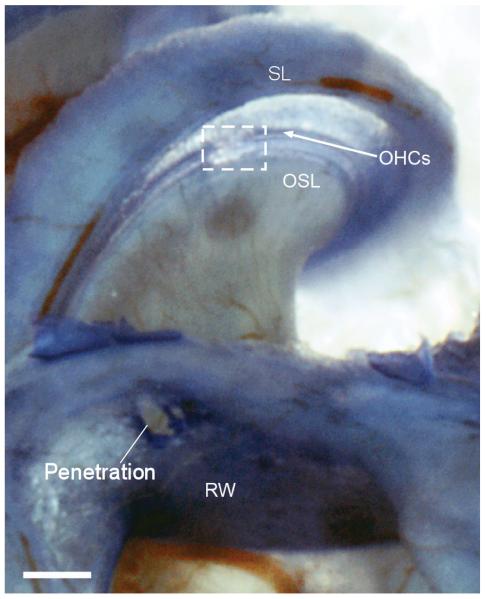
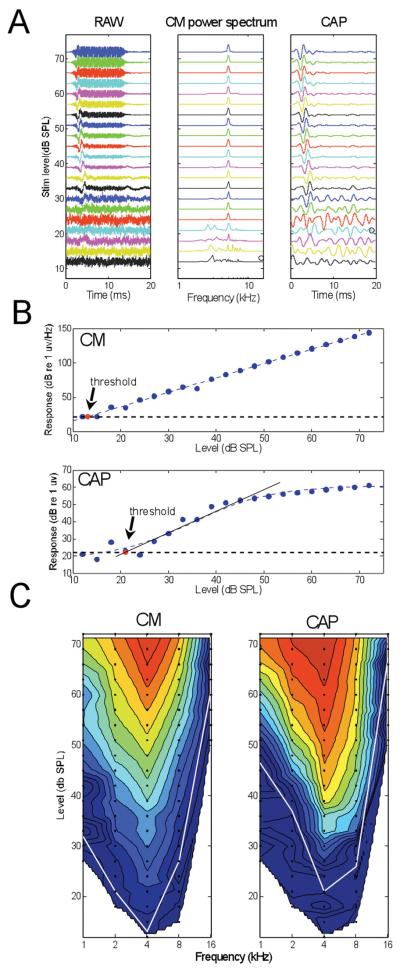
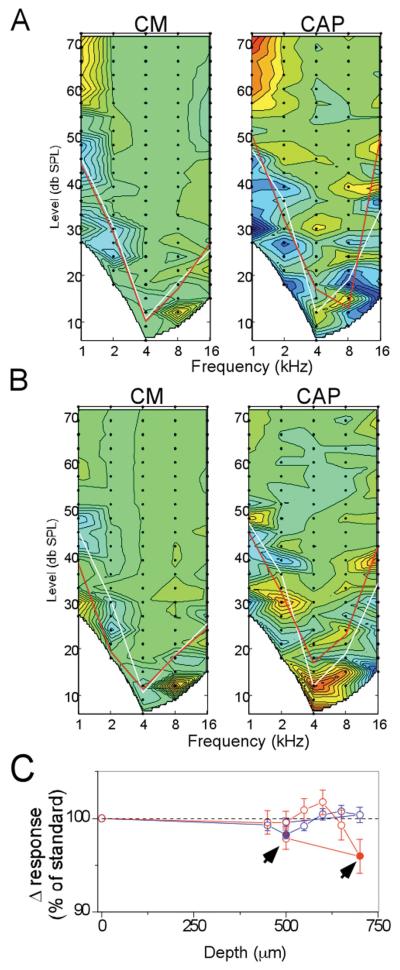
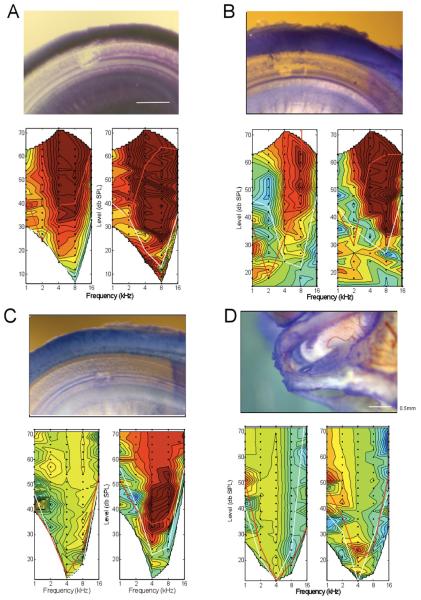
Methods: : A metal electrode was placed on the surface of the round window, and recordings of the cochlear microphonic (CM) and compound action potential (CAP) were made in response to stimulation with tone-bursts at various frequencies in 1-octave intervals and at intensities of 15 to 72 dB sound pressure level. The electrode was then advanced incrementally, with CM and CAP measurements obtained at each step. These data were compared with data obtained at the round window, and the electrode was withdrawn when a significant change was observed. After electrophysiological analysis, the cochlea was examined histologically.

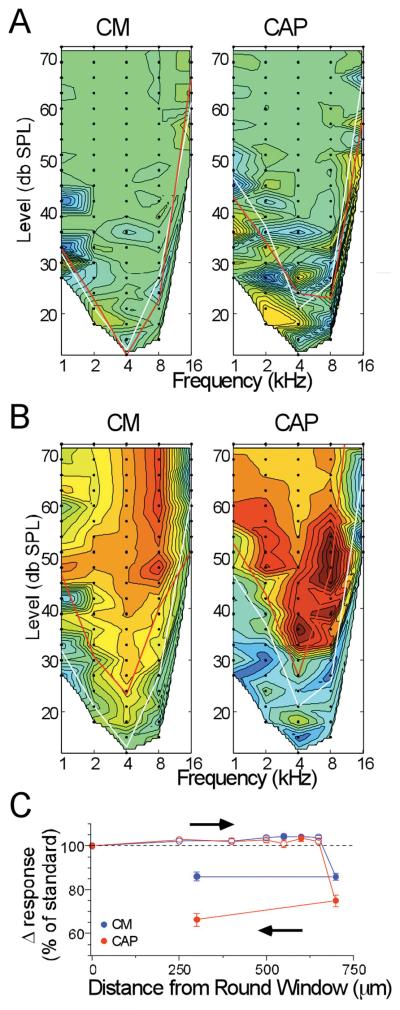
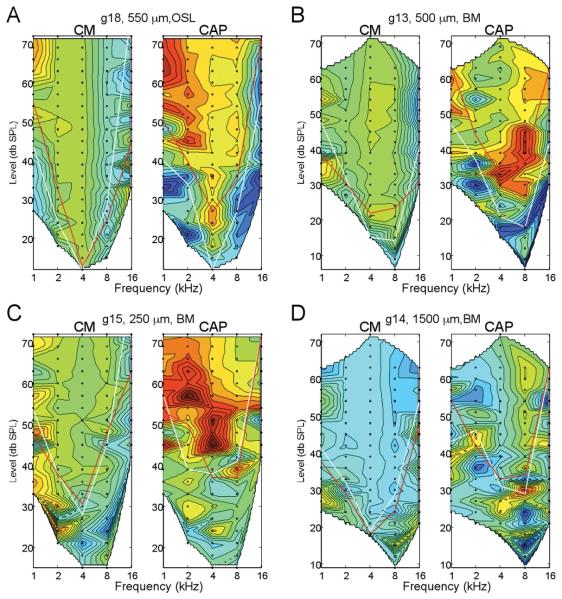
Results: : Results show that on electrode insertion, loss of amplitude in the CM and CAP occurs after damage to cochlear structures. Loss of activity was typically first apparent in the CAP rather than the CM.

Conclusion: : These results suggest that a reduction of the CAP can be an early marker of interaction of the electrode with cochlear structures. Such measurements are potentially available with slight modifications to current cochlear implant technology.


Figures

Figure 1
Figure 1
Example of damage to basilar membrane caused by the electrode. The preparation shown is a decalcified toludine blue stained whole mount. Damage is outlined by the box. The physiology data in Figures 2-4 is from this case. SL: spiral ligament; OHCs: Outer hair cells; OSL: osseous spiral lamina; RW: Round window.
Figure 2
Figure 2
Example CM and CAP recordings from just inside the round window. A: Level series at a single frequency (4 kHz). Left panel is the raw recording which contains the sinusoidal CM lasting for the duration of the stimulus and riding on the CAP which occurs near the beginning of the stimulus. Middle panel is the power spectrum of the CM, taken from an epoch (7-12 ms) uncontaminated by the CAP. Right panel is the raw recording filtered from 500-1.5 kHz to extract the CAP. Signals in each panel are normalized to the maximum amplitude for each stimulus level, such that the noise levels increase as the stimulus level is lowered. B: Thresholds for the CM and CAP were estimated as the stimulus level at which the response reached the noise floor. For the CM, the linear response was fit with a straight line. For the CAP, the saturating response was fit with a logistic function, and a line fit to slope at the 50% response magnitude. C: Contour plots of CM and CAP magnitude as a function of frequency and level. The color scale for the contour plot of the CM is from 25 (dark blue) to 160 dB (red, re 1 μV/Hz) and for the CM is from 25 to 60 dB (re 1 μV). The same color scales were used for all contour plots herein. Data points taken are shown as filled circles. The white lines are thresholds at each frequency.
Figure 3
Figure 3
Results of CM and CAP recordings at different depths of insertion. A: Depth = 250 mm. B: Depth=700 mm. These figures are contour plots of the difference between the standard response at the round window and the test response at the depth of insertion. Green is no difference, blue is an increased response and red is a decreased response compared to the standard (color scale of the CM is from 25, dark blue, to 160 dB, red, re 1 μV/Hz, and for the CM is from 25 to 60 dB, re 1 μV). White lines are the thresholds of the standard and red lines are the thresholds at the test depth. C: Results of the complete track in this case. Each point is the average response of all data points that were above threshold in either the test or standard, expressed as a percent of the average response level at the round window (responses measured in dB, as in Figure 2B).
Figure 4
Figure 4
Four examples where the CAP showed a loss of response where the CM did not. For each case, depth and site of anatomical damage is indicated. In each case the loss of response, indicated by warmer colors, in the CAP was significant while that of the CM was not. Note that in two cases (A and C), the loss of response occurred at low frequencies, while in two cases (B and D) it was primarily at high frequencies. This variability does not appear to be due to the site of damage, as changes in the same frequency ranges have been seen when the damage was to the BM or the OSL. The reverse scenario, on where the CM is reduced prior to the CAP, has not been seen in any animal tested so far. Thus, a slight decrease in the CAP response appears to be the most sensitive marker of cochlear damage under these conditions (color scale of the CM is from 25, dark blue, to 160 dB, red, re 1 μV/Hz, and for the CM is from 25 to 60 dB, re 1 μV).
Figure 5
Figure 5
Example of a case where the physiological changes were reversible when the electrode was withdrawn. A: An initial significant decrease in the CAP magnitude occurred at low frequencies and high intensities, with a smaller and not significant change in the CM. B: After the electrode was withdrawn, the response changes disappeared (color scale of the CM is from 25, dark blue, to 160 dB, red, re 1 μV/Hz, and for the CM is from 25 to 60 dB, re 1 μV). C: The complete track for this case, with the sites shown in A and B indicated by arrowheads (right arrowhead is shown in A, and left arrowhead is shown in B).
Figure 6
Figure 6
A: Extensive damage on the basilar membrane; the loss of electrophysiologic activity was extensive and irreversible. The damage consisted of a clear breach of the basilar membrane, loss of hair cells, and damage to supporting cells lateral to the OHCs. B: Trauma similar to that previously seen in the case shown in Figures 1-4. The damage consisted of a clear breach of the basilar membrane, loss of hair cells and some supporting cells. The loss of response in the CAP was extensive but that to the CM was moderate. C: Damage on the basilar membrane restricted to a small site underneath the hair cells and tunnel of Corti. On close inspection there appeared to still be a thin layer of membrane separating the scala tympani and scala media. Although there was loss of hair cells, it is possible that the reticular lamina was either not breached such that mixing of endolymph and perilymph either did not occur or was minimal. The magnitude of response loss was moderate for the CAP, and minimal for the CM. D: No damage to the basilar membrane. Instead, there was a region of damage on the OSL, which appeared to be a flake of bone that was lifted up allowing stain to be trapped. In this case, the damage to both the CM and CAP was minimal, and reversed to a substantial degree after withdrawal of the electrode.

References

    1. von Ilberg C, Kiefer J, Tillein J, et al. Electric-acoustic stimulation of the auditory system. New technology for severe hearing loss. ORL J Otorhinolaryngol Relat Spec. 1999;61:334–340. - PubMed
    1. Gstoettner WK, van de Heyning P, O’Connor AF, et al. Electric acoustic stimulation of the auditory system: results of a multi-centre investigation. Acta Otolaryngol. 2008;128:968–975. - PubMed
    1. Skarzynski H, Lorens A, Piotrowska A. A new method of partial deafness treatment. Med Sci Monit. 2003;9:CS20–24. - PubMed
    1. Simmons JA, Lavender WA, Lavender BA, et al. Target structure and echo spectral discrimination by echolocating bats. Science. 1974;186:1130–1132. - PubMed
    1. James C, Albegger K, Battmer R, et al. Preservation of residual hearing with cochlear implantation: how and why. Acta Otolaryngol. 2005;125:481–491. - PubMed

Publication types