Comparative Study
. 2010 Oct;42(10):851-8.
doi: 10.1038/ng.659. Epub 2010 Sep 5.

High-throughput, pooled sequencing identifies mutations in NUBPL and FOXRED1 in human complex I deficiency

Affiliations
Comparative Study

High-throughput, pooled sequencing identifies mutations in NUBPL and FOXRED1 in human complex I deficiency

Sarah E Calvo et al. Nat Genet. 2010 Oct.

Abstract

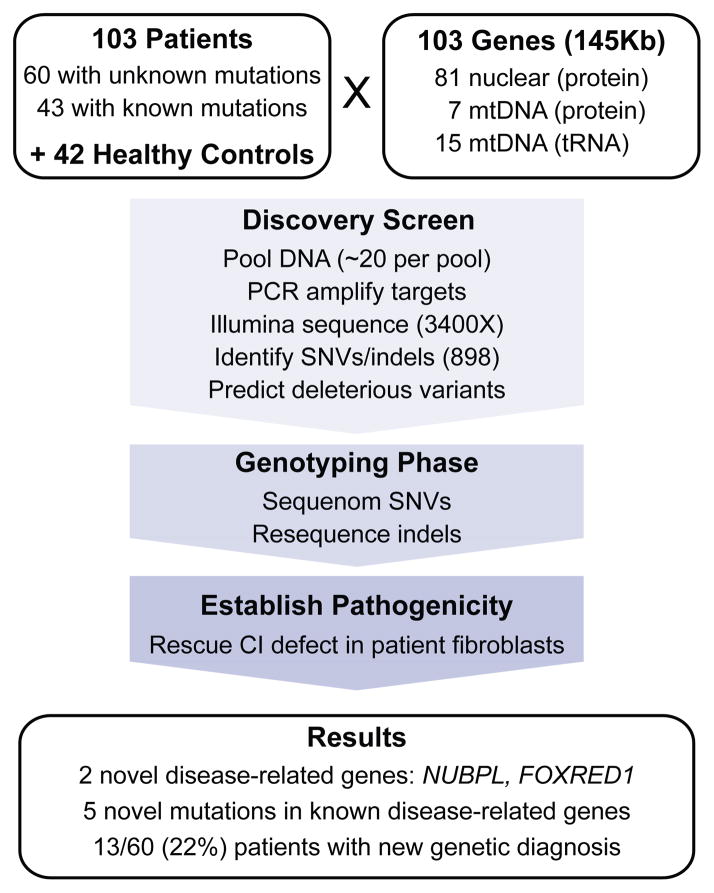
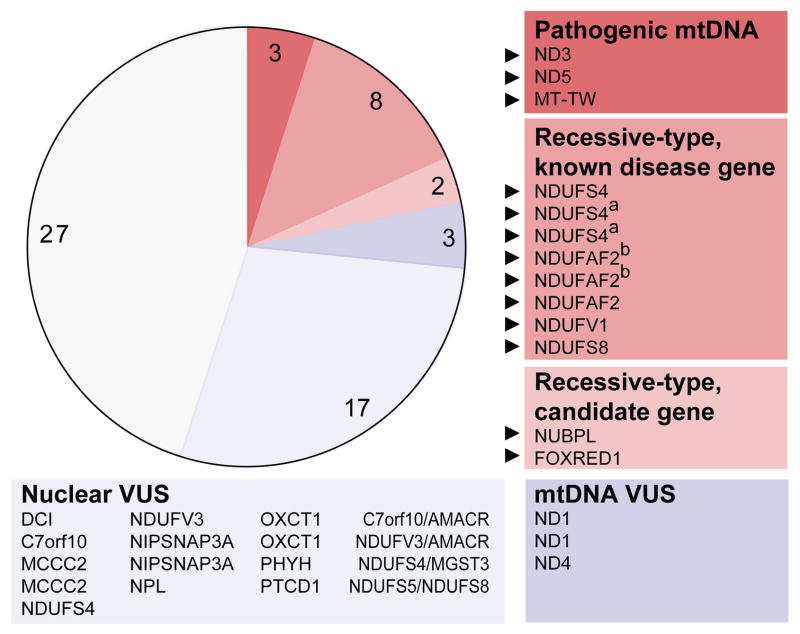
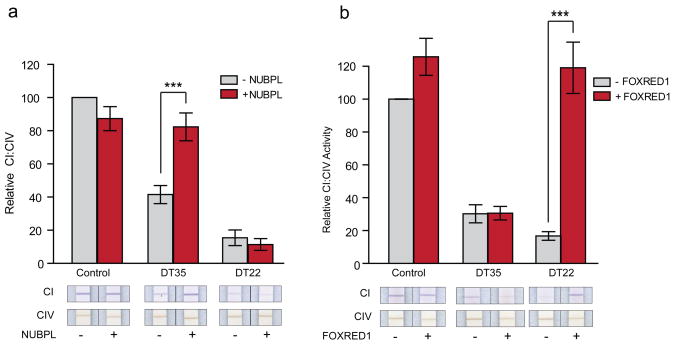
Discovering the molecular basis of mitochondrial respiratory chain disease is challenging given the large number of both mitochondrial and nuclear genes that are involved. We report a strategy of focused candidate gene prediction, high-throughput sequencing and experimental validation to uncover the molecular basis of mitochondrial complex I disorders. We created seven pools of DNA from a cohort of 103 cases and 42 healthy controls and then performed deep sequencing of 103 candidate genes to identify 151 rare variants that were predicted to affect protein function. We established genetic diagnoses in 13 of 60 previously unsolved cases using confirmatory experiments, including cDNA complementation to show that mutations in NUBPL and FOXRED1 can cause complex I deficiency. Our study illustrates how large-scale sequencing, coupled with functional prediction and experimental validation, can be used to identify causal mutations in individual cases.


Figures

Figure 1
Figure 1
Schematic overview of the Mito10K project.
Figure 2
Figure 2
Definition of ‘likely deleterious’ variants detected in pooled sequencing discovery screen. (a) Barplot of high-confidence and low-confidence variants, categorized by predicted deleterious consequences. (b) Histogram of known disease-associated splice variants, annotated in HGMD, by position relative to nearest splice donor and splice acceptor exons (black rectangles). Dashed line indicates frequency threshold and asterisk indicates splice positions considered ‘likely deleterious’. (c) Histogram of amino acid conservation score (# species with identical amino acid, out of 44 aligned vertebrate exons) shown for training data: missense variants annotated as disease-associated in HGMD (red curve) or present in dbSNP128 (blue curve). Dashed line indicates minimum conservation required for ‘likely deleterious’ variants.
Figure 3
Figure 3
60 patients with CI deficiency without a prior genetic diagnosis, categorized by type of ‘likely deleterious’ variants detected per gene. Red indicates patients with likely pathogenic variants, blue indicates patients with variants of uncertain significance (VUS), and gray indicates patients without ‘likely deleterious’ variants. Boxes list genes containing ‘likely deleterious’ variants in each patient. Black triangles indicate new experimentally established genetic diagnoses. a,b indicate pairs of affected siblings.
Figure 4
Figure 4
NUBPL and FOXRED1 cDNA rescue of CI defects in patient fibroblasts. Barplots show CI activity, normalized by CIV activity, measured in control and patient fibroblasts, before and after transduction with wild-type NUBPL-V5 mRNA (a) or wild-type FOXRED1-V5 mRNA (b). Bars show mean of 3 biological replicates, and error bars indicate ±1 s.e.m. Asterisks indicate p<0.01. Representative dipstick assays shown below.
Figure 5
Figure 5
Genetic diagnosis of 94 unrelated patients with definite, isolated complex I deficiency grouped by function of underlying gene. Red indicates patients with confirmed genetic diagnosis, and gray indicates absence of genetic diagnosis. Patients are representative cohort, selected as all unrelated individuals within the 103 patients sequenced.

References

    1. Skladal D, Halliday J, Thorburn DR. Minimum birth prevalence of mitochondrial respiratory chain disorders in children. Brain. 2003;126:1905–12. - PubMed
    1. Distelmaier F, et al. Mitochondrial complex I deficiency: from organelle dysfunction to clinical disease. Brain. 2009;132:833–42. - PubMed
    1. Janssen RJ, Nijtmans LG, van den Heuvel LP, Smeitink JA. Mitochondrial complex I: structure, function and pathology. J Inherit Metab Dis. 2006;29:499–515. - PubMed
    1. Lazarou M, Thorburn DR, Ryan MT, McKenzie M. Assembly of mitochondrial complex I and defects in disease. Biochim Biophys Acta. 2009;1793:78–88. - PubMed
    1. Bernier FP, et al. Diagnostic criteria for respiratory chain disorders in adults and children. Neurology. 2002;59:1406–11. - PubMed

Publication types

MeSH terms