

An integrated genomic analysis of aryl hydrocarbon receptor-mediated inhibition of B-cell differentiation
- PMID: 20819909
- PMCID: PMC3003543
- DOI: 10.1093/toxsci/kfq265
An integrated genomic analysis of aryl hydrocarbon receptor-mediated inhibition of B-cell differentiation
Abstract
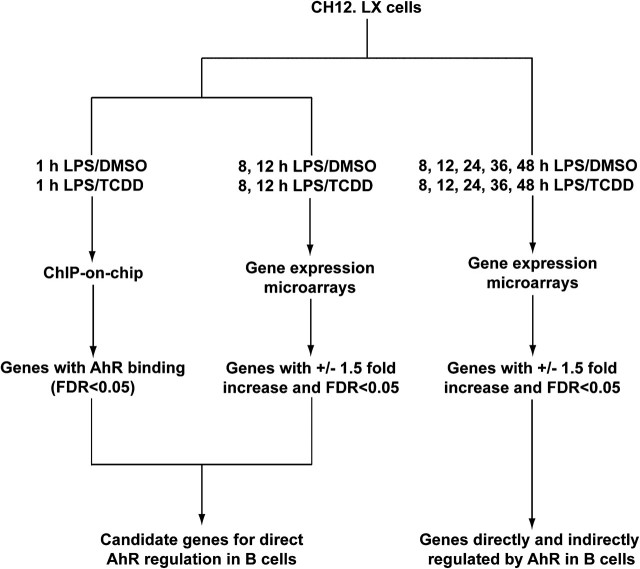
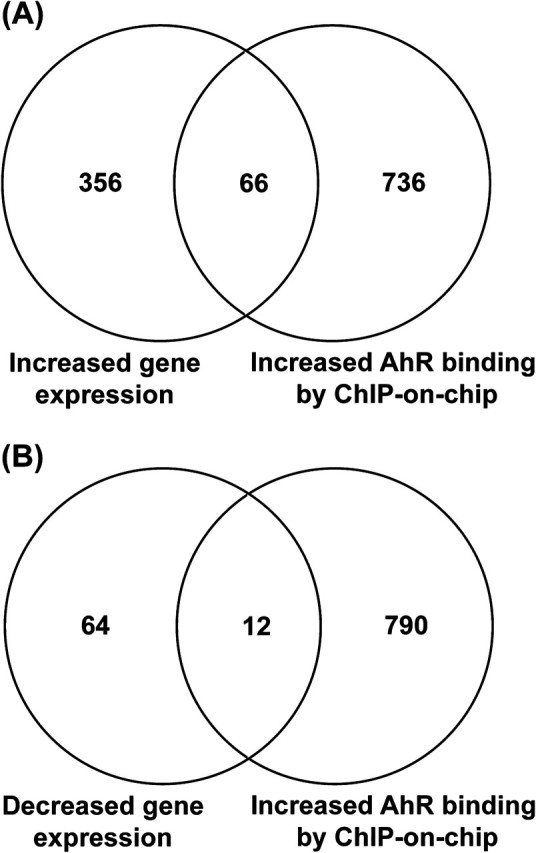
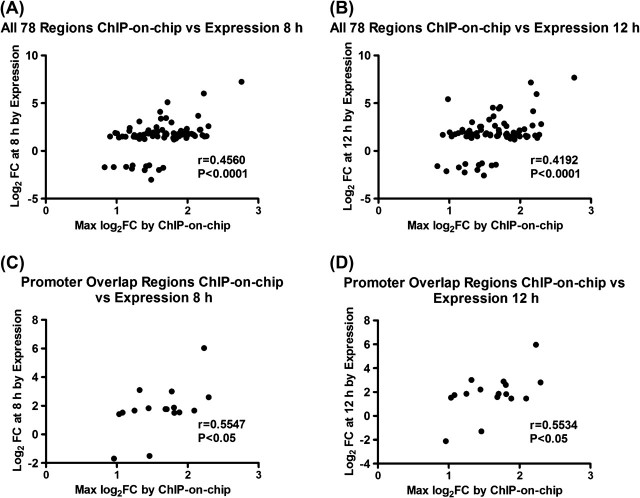
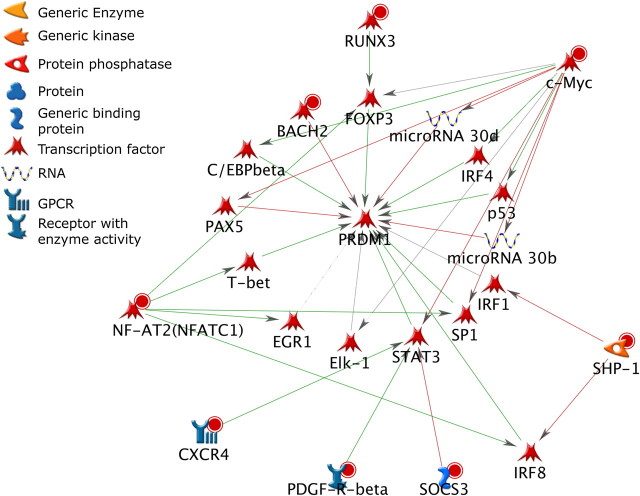
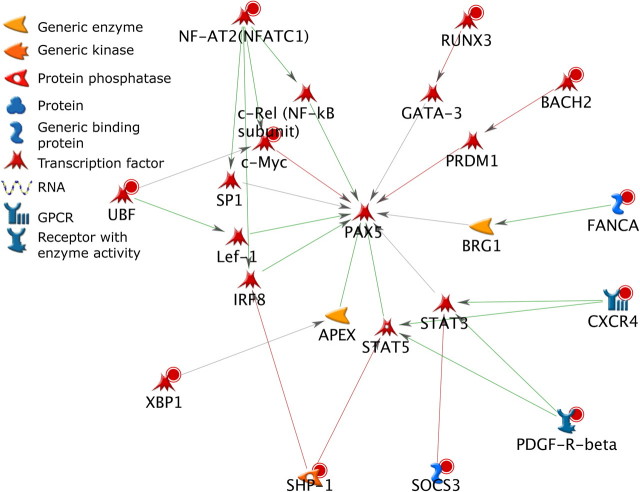
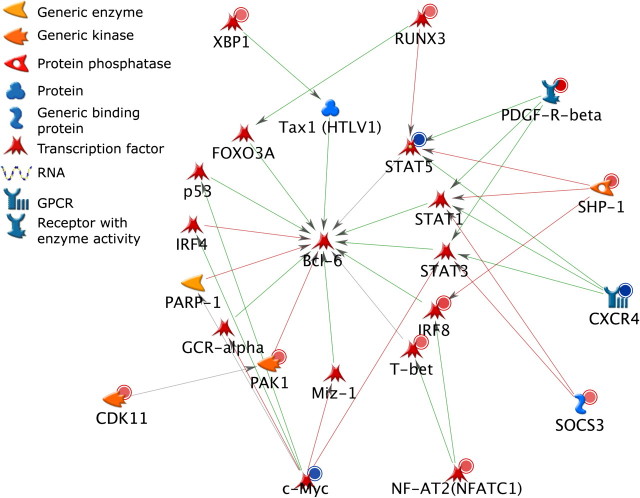
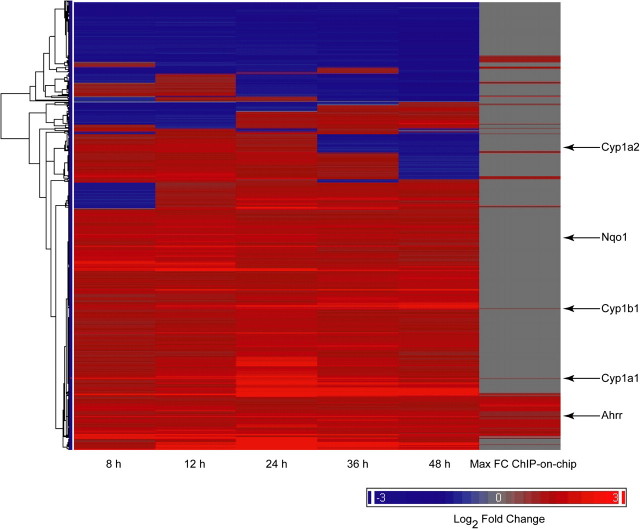
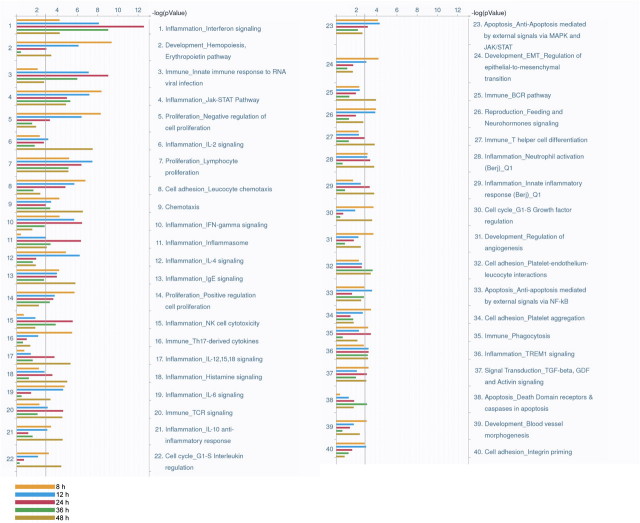
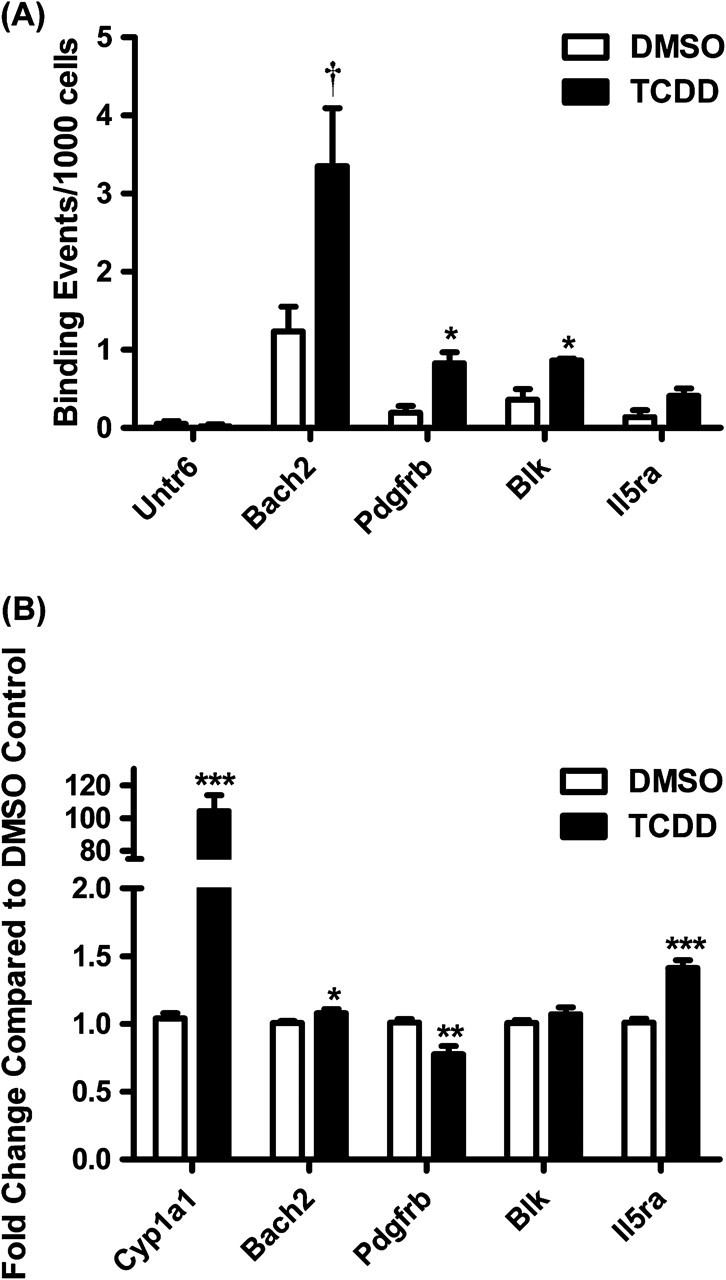
The aryl hydrocarbon receptor (AHR) agonist 2,3,7,8-tetrachlorodibenzo-p-dioxin (TCDD) alters differentiation of B cells and suppresses antibody production. A combination of whole-genome, microarray-based chromatin immunoprecipitation (ChIP-on-chip), and time course gene expression microarray analysis was performed on the mouse B-cell line CH12.LX following exposure to lipopolysaccharide (LPS) or LPS and TCDD to identify the primary and downstream transcriptional elements of B-cell differentiation that are altered by the AHR. ChIP-on-chip analysis identified 1893 regions with a significant increase in AHR binding with TCDD treatment. Transcription factor binding site analysis on the ChIP-on-chip data showed enrichment in AHR response elements. Other transcription factors showed significant coenrichment with AHR response elements. When ChIP-on-chip regions were compared with gene expression changes at the early time points, 78 genes were identified as potential direct targets of the AHR. AHR binding and expression changes were confirmed for a subset of genes in primary mouse B cells. Network analysis examining connections between the 78 potential AHR target genes and three transcription factors known to regulate B-cell differentiation indicated multiple paths for potential regulation by the AHR. Enrichment analysis on the differentially expressed genes at each time point evaluated the downstream impact of AHR-regulated gene expression changes on B-cell-related processes. AHR-mediated impairment of B-cell differentiation occurred at multiple nodes of the B-cell differentiation network and potentially through multiple mechanisms including direct cis-acting effects on key regulators of B-cell differentiation, indirect regulation of B-cell differentiation-related pathways, and transcriptional coregulation of target genes by AHR and other transcription factors.
Figures
Similar articles
-
Aryl hydrocarbon receptor-dependent suppression by 2,3,7, 8-tetrachlorodibenzo-p-dioxin of IgM secretion in activated B cells.Mol Pharmacol. 1998 Apr;53(4):623-9. Mol Pharmacol. 1998. PMID: 9547351
-
Integration of genome-wide computation DRE search, AhR ChIP-chip and gene expression analyses of TCDD-elicited responses in the mouse liver.BMC Genomics. 2011 Jul 15;12:365. doi: 10.1186/1471-2164-12-365. BMC Genomics. 2011. PMID: 21762485 Free PMC article.
-
Aryl hydrocarbon receptor-dependent inhibition of AP-1 activity by 2,3,7,8-tetrachlorodibenzo-p-dioxin in activated B cells.Toxicol Appl Pharmacol. 2002 Jun 1;181(2):116-23. doi: 10.1006/taap.2002.9403. Toxicol Appl Pharmacol. 2002. PMID: 12051995
-
The long winding road toward understanding the molecular mechanisms for B-cell suppression by 2,3,7,8-tetrachlorodibenzo-p-dioxin.Toxicol Sci. 2011 Mar;120 Suppl 1(Suppl 1):S171-91. doi: 10.1093/toxsci/kfq324. Epub 2010 Oct 15. Toxicol Sci. 2011. PMID: 20952503 Free PMC article. Review.
-
Role of coactivators in transcriptional activation by the aryl hydrocarbon receptor.Arch Biochem Biophys. 2005 Jan 15;433(2):379-86. doi: 10.1016/j.abb.2004.09.031. Arch Biochem Biophys. 2005. PMID: 15581594 Review.
Cited by
-
Mononuclear phagocyte regulation by the transcription factor Blimp-1 in health and disease.Immunology. 2020 Dec;161(4):303-313. doi: 10.1111/imm.13249. Epub 2020 Sep 27. Immunology. 2020. PMID: 32799350 Free PMC article. Review.
-
Genome-Wide Transcriptional Analysis Reveals Novel AhR Targets That Regulate Dendritic Cell Function during Influenza A Virus Infection.Immunohorizons. 2019 Jun 17;3(6):219-235. doi: 10.4049/immunohorizons.1900004. Immunohorizons. 2019. PMID: 31356168 Free PMC article.
-
Aryl Hydrocarbon Receptor Activation Suppresses EBF1 and PAX5 and Impairs Human B Lymphopoiesis.J Immunol. 2017 Nov 15;199(10):3504-3515. doi: 10.4049/jimmunol.1700289. Epub 2017 Oct 4. J Immunol. 2017. PMID: 28978690 Free PMC article.
-
SHP-1 is directly activated by the aryl hydrocarbon receptor and regulates BCL-6 in the presence of 2,3,7,8-tetrachlorodibenzo-p-dioxin (TCDD).Toxicol Appl Pharmacol. 2016 Nov 1;310:41-50. doi: 10.1016/j.taap.2016.08.014. Epub 2016 Aug 18. Toxicol Appl Pharmacol. 2016. PMID: 27546522 Free PMC article.
-
Reciprocal regulation of amino acid import and epigenetic state through Lat1 and EZH2.EMBO J. 2015 Jul 2;34(13):1773-85. doi: 10.15252/embj.201488166. Epub 2015 May 15. EMBO J. 2015. PMID: 25979827 Free PMC article.
References
-
- Barhoover MA, Hall JM, Greenlee WF, Thomas RS. Aryl hydrocarbon receptor regulates cell cycle progression in human breast cancer cells via a functional interaction with cyclin-dependent kinase 4. Mol. Pharmacol. 2010;77:195–201. - PubMed
-
- Battistini A. Interferon regulatory factors in hematopoietic cell differentiation and immune regulation. J. Interferon Cytokine Res. 2009;29:765–780. - PubMed
-
- Benjamini Y, Hochberg Y. Controlling the false discovery rate: a practical and powerful approach to multiple testing. J. R. Stat. Soc. Ser. B. 1995;57:289–300.
-
- Calame K. Activation-dependent induction of Blimp-1. Curr. Opin. Immunol. 2008;20:259–264. - PubMed
Publication types
MeSH terms
Substances
Grants and funding
LinkOut - more resources
Full Text Sources
Other Literature Sources
Molecular Biology Databases
