Analysis of the CYP1A1 mRNA dose-response in human keratinocytes indicates that relative potencies of dioxins, furans, and PCBs are species and congener specific
- PMID: 20819910
- PMCID: PMC6944437
- DOI: 10.1093/toxsci/kfq262
Analysis of the CYP1A1 mRNA dose-response in human keratinocytes indicates that relative potencies of dioxins, furans, and PCBs are species and congener specific
Abstract
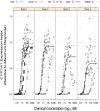
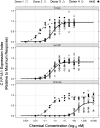
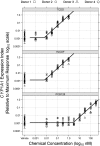
Reports indicate that toxic equivalency factors (TEFs) based primarily on rodent data do not accurately predict in vitro human responsiveness to certain dioxin-like chemicals (DLCs). To investigate this in cells responsive to dioxins and relevant to chloracne, normal human epidermal keratinocytes were treated with 2,3,7,8-tetrachlorodibenzo-p-dioxin (TCDD) and several DLCs, each with a TEF value of 0.1, representing three classes of congeners. We estimated half maximal effective concentration (EC50)-based donor-specific relative potency (REP) values for cytochrome P450 1A1 (CYP1A1) messenger RNA (mRNA) induction for TCDD, 1,2,3,6,7,8-hexachlorodibenzo-p-dioxin (HxCDD), 2,3,7,8-tetrachlorodibenzofuran (TCDF), 1,2,3,6,7,8-hexachlorodibenzofuran (HxCDF), and 3,3',4,4',5-pentachlorobiphenyl (PCB 126). We also determined EC50-based population-level REP values (n = 4) for CYP1A1 mRNA induction for TCDD, HxCDF, and PCB 126. Furthermore, an alternative factor, the relative threshold factor (RTF) based on the low end (threshold) of the dose-response curve, was calculated. Our results demonstrated that HxCDF had a population-based REP value of 0.98, 9.8-fold higher than its assigned TEF value of 0.1. Conversely, PCB 126 had an REP value of 0.0027 and an RTF of 0.0022, 37-fold and 45-fold less than its assigned TEF of 0.1, respectively. The REP values for HxCDD and TCDF were 0.24 and 0.10, respectively, similar to their assigned value of 0.1. Therefore, although the DLCs tested in the current study all possessed the same assigned TEF value of 0.1, congener-specific differences in REPs and RTFs were observed for human keratinocytes. These congener-specific discrepancies are likely because of differences in interspecies factors that have yet to be defined.
Figures


Similar articles
-
Relative effect potency estimates of dioxin-like activity for dioxins, furans, and dioxin-like PCBs in adults based on cytochrome P450 1A1 and 1B1 gene expression in blood.Environ Int. 2016 Nov;96:24-33. doi: 10.1016/j.envint.2016.08.016. Epub 2016 Aug 31. Environ Int. 2016. PMID: 27588699 Free PMC article.
-
Differential relative effect potencies of some dioxin-like compounds in human peripheral blood lymphocytes and murine splenic cells.Toxicol Lett. 2014 Apr 7;226(1):43-52. doi: 10.1016/j.toxlet.2014.01.026. Epub 2014 Jan 26. Toxicol Lett. 2014. PMID: 24472611
-
A sensitivity analysis using alternative toxic equivalency factors to estimate U.S. dietary exposures to dioxin-like compounds.Regul Toxicol Pharmacol. 2013 Nov;67(2):278-84. doi: 10.1016/j.yrtph.2013.08.007. Epub 2013 Aug 21. Regul Toxicol Pharmacol. 2013. PMID: 23973911
-
The 2005 World Health Organization reevaluation of human and Mammalian toxic equivalency factors for dioxins and dioxin-like compounds.Toxicol Sci. 2006 Oct;93(2):223-41. doi: 10.1093/toxsci/kfl055. Epub 2006 Jul 7. Toxicol Sci. 2006. PMID: 16829543 Free PMC article. Review.
-
Development validation and problems with the toxic equivalency factor approach for risk assessment of dioxins and related compounds.J Anim Sci. 1998 Jan;76(1):134-41. doi: 10.2527/1998.761134x. J Anim Sci. 1998. PMID: 9464894 Review.
Cited by
-
Relative effect potency estimates of dioxin-like activity for dioxins, furans, and dioxin-like PCBs in adults based on cytochrome P450 1A1 and 1B1 gene expression in blood.Environ Int. 2016 Nov;96:24-33. doi: 10.1016/j.envint.2016.08.016. Epub 2016 Aug 31. Environ Int. 2016. PMID: 27588699 Free PMC article.
-
Development and application of a systematic and quantitative weighting framework to evaluate the quality and relevance of relative potency estimates for dioxin-like compounds (DLCs) for human health risk assessment.Regul Toxicol Pharmacol. 2023 Dec;145:105500. doi: 10.1016/j.yrtph.2023.105500. Epub 2023 Oct 21. Regul Toxicol Pharmacol. 2023. PMID: 37866700 Free PMC article.
-
Aryl Hydrocarbon Receptor (AhR) Ligands as Selective AhR Modulators: Genomic Studies.Curr Opin Toxicol. 2018 Oct-Dec;11-12:10-20. doi: 10.1016/j.cotox.2018.11.005. Epub 2018 Nov 22. Curr Opin Toxicol. 2018. PMID: 31453421 Free PMC article.
-
Pollutants in pet dogs: a model for environmental links to breast cancer.Springerplus. 2015 Jan 22;4:27. doi: 10.1186/s40064-015-0790-4. eCollection 2015. Springerplus. 2015. PMID: 25646150 Free PMC article.
-
Evaluation of relative effect potencies (REPs) for dioxin-like compounds to derive systemic or human-specific TEFs to improve human risk assessment.Arch Toxicol. 2016 Jun;90(6):1293-305. doi: 10.1007/s00204-016-1724-9. Epub 2016 May 9. Arch Toxicol. 2016. PMID: 27161441 Free PMC article. Review.
References
-
- Akaike H. A new look at the statistical model identification. IEEE Trans. Automat. Contr. 1974;19:716–723.
-
- Bacon DW, Watts DG. Estimating the transition between two intersecting straight lines. Biometrika. 1971;58:525–534.
-
- Bailey GS, Orner GA, Pereira CB, Swenberg JA. Response to the Waddell et al. letter. Chem. Res. Toxicol. 2009a;22:1493–1494.

