. 2010 Dec;118(2):696-703.
doi: 10.1093/toxsci/kfq264. Epub 2010 Sep 6.

Deviations from Haber's Law for multiple measures of acute lung injury in chlorine-exposed mice

Affiliations

Deviations from Haber's Law for multiple measures of acute lung injury in chlorine-exposed mice

Gary W Hoyle et al. Toxicol Sci. 2010 Dec.

Abstract

Chlorine gas is considered a chemical threat agent that can cause acute lung injury. Studies in the early 20th century on war gases led Haber to postulate that the dose of an inhaled chemical expressed as the product of gas concentration and exposure time leads to a constant toxicological effect (Haber's Law). In the present work, mice were exposed to a constant dose of chlorine (100 ppm-h) delivered using different combinations of concentration and time (800 ppm/7.5 min, 400 ppm/15 min, 200 ppm/30 min, and 100 ppm/60 min). Significant effects of exposure protocol on survival evaluated 6 h after exposure were observed, ranging from 0% for the 7.5-min exposure to 100% for the 30- and 60-min exposures. Multiple parameters indicative of lung injury were examined to determine if any aspects of lung injury were differentially affected by the exposure protocols. Most parameters (pulmonary edema, neutrophil influx, and levels of protein, immunoglobulin M, and the chemokine KC [Cxcl1] in lavage fluid) indicated that lung injury was most pronounced for the 15-min exposure and least for the 60-min exposure. In contrast, changes in pulmonary function at baseline and in response to inhaled methacholine were similar following the three exposure regimens. The results indicate that the extent of lung injury following chlorine inhalation depends not only on total dose but also on the specifics of exposure concentration and time, and they suggest that evaluation of countermeasures against chlorine-induced lung injury should be performed using multiple types of exposure scenarios.


Figures
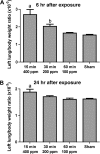
FIG. 1.
FIG. 1.
Effect of chlorine exposures on lung weight. Mice were sham exposed or were exposed to a target dose of 100 ppm-h chlorine delivered over different times (15, 30, or 60 min). Left lung lobes were collected and weighed 6 h (A) or 24 h (B) after exposure. The ratio of the wet weight of the left lung to the body weight of each mouse was calculated. (A) a, p < 0.001 versus 60 min and sham exposures; b, p < 0.05 versus 60 min and sham exposures. n = 8 mice per group. (B) a, p < 0.05 versus sham exposures. n = 6–8 mice per group.
FIG. 2.
FIG. 2.
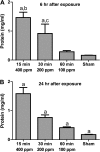
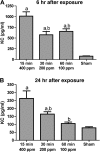
Effect of chlorine exposures on lavage fluid protein. Lungs were lavaged 6 h (A) or 24 h (B) after chlorine exposure, and protein concentration was measured in lavage fluid. (A) a, p < 0.001 versus sham; b, p < 0.001 versus 60 min; c, p < 0.05 versus 15 and 60 min. (B) a, p < 0.001 versus all other groups. n = 5–8 mice per group.
FIG. 3.
FIG. 3.
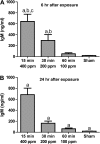
Effect of chlorine exposures on lavage fluid IgM. Lungs were lavaged 6 h (A) or 24 h (B) after chlorine exposure, and IgM concentration in lavage fluid was measured by enzyme-linked immunosorbent assay. (A) a, p < 0.001 versus sham; b, p < 0.001 versus 60 min; c, p < 0.05 versus 30 min. (B) a, p < 0.01 versus all other groups. n = 5–8 mice per group.
FIG. 4.
FIG. 4.
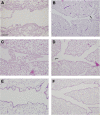
Lung histology in chlorine-exposed mice. (A) Large airway from mouse exposed to 400 ppm chlorine for 15 min analyzed 6 h after exposure showing widespread epithelial damage. (B) Longitudinal section of distal airway branching from mouse exposed to 400 ppm chlorine for 15 min and analyzed at 6 h. Visible damage to the airway epithelium is widespread and extends (arrow) almost to terminal bronchiole. (C) Airway from mouse exposed to 400 ppm for 15 min analyzed 24 h after exposure showing sloughed epithelium in airway lumen. (D) Longitudinal section of airway branching from mouse exposed to 100 ppm chlorine for 60 min and analyzed at 6 h. Epithelial damage can be seen in the proximal airway at left (arrow) but is not apparent distal to this point. (E) Airway from sham-exposed mouse. (F) Longitudinal section of airway branching from sham-exposed mouse. Scale bar in panel A represents 100μM in (A), (C) and (E), 200μM in (B), (D), and (F).
FIG. 5.
FIG. 5.
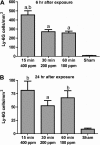
Effect of chlorine exposures on neutrophil influx. Lungs were fixed for analysis 6 h (A) or 24 h (B) after chlorine exposure, and neutrophil influx was measured by immunostaining for Ly-6G. (A) a, p < 0.001 versus sham; b, p < 0.001 versus 30 and 60 min. n = 8 mice per group. (B) a, p < 0.05 versus sham; b, p < 0.01 versus sham. n = 6–8 mice per group.
FIG. 6.
FIG. 6.
Effect of chlorine exposures on lavage fluid KC. Lungs were lavaged 6 h (A) or 24 h (B) after chlorine exposure, and KC in lavage fluid was measured by enzyme-linked immunosorbent assay. (A) a, p < 0.001 versus sham; b, p < 0.01 versus 15 min. n = 7–8 mice per group. (B) a, p < 0.05 versus sham; b, p < 0.05 versus 15 min. n = 5–8 mice per group.
FIG. 7.
FIG. 7.
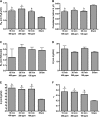
Effect of chlorine exposures on baseline respiratory parameters. Respiratory parameters were measured in anesthetized, mechanically ventilated mice 1 day after chlorine exposure. Rrs, respiratory system resistance; Rn, Newtonian resistance; H, tissue elastance; G, tissue damping; η, G/H (ratio of tissue energy dissipation to tissue energy storage). a, p < 0.05 versus sham; b, p < 0.01 versus sham; c, p < 0.001 versus sham. n = 6–8 mice per group.
FIG. 8.
FIG. 8.
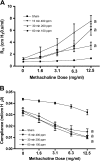
Effect of chlorine exposures on airway reactivity to methacholine. One day after chlorine exposure, Rrs (A) and compliance (B) were measured at baseline and following increasing doses of aerosolized methacholine. (A) a, Methacholine dose-response curve different from sham at p < 0.01. (B) a, Methacholine dose-response curve different from sham at p < 0.001. n = 6–8 mice per group.

Similar articles

Cited by

References

    1. Adelson L, Kaufman J. Fatal chlorine poisoning: report of two cases with clinicopathologic correlation. Am. J. Clin. Pathol. 1971;56:430–442. - PubMed
    1. Barrow CS, Kociba RJ, Rampy LW, Keyes DG, Albee RR. An inhalation toxicity study of chlorine in Fischer 344 rats following 30 days of exposure. Toxicol. Appl. Pharmacol. 1979;49:77–88. - PubMed
    1. Bitron MD, Aharonson EF. Delayed mortality of mice following inhalation of acute doses of CH2O, SO2Cl2, and Br2. Am. Ind. Hyg. Assoc. J. 1978;39:129–138. - PubMed
    1. Bliss CI. The relation between exposure time, concentration and toxicity in experiments on insecticides. Ann. Entomol. Soc. Am. 1940;33:721–766.
    1. Dellaca RL, Zannin E, Sancini G, Rivolta I, Leone BE, Pedotti A, Miserocchi G. Changes in the mechanical properties of the respiratory system during the development of interstitial lung edema. Respir. Res. 2008;9:51. - PMC - PubMed

Publication types

MeSH terms