. 2010 Sep 6;190(5):761-76.
doi: 10.1083/jcb.200912167.

Dynamic plasticity of large-scale chromatin structure revealed by self-assembly of engineered chromosome regions

Affiliations

Dynamic plasticity of large-scale chromatin structure revealed by self-assembly of engineered chromosome regions

Paul Sinclair et al. J Cell Biol. .

Abstract

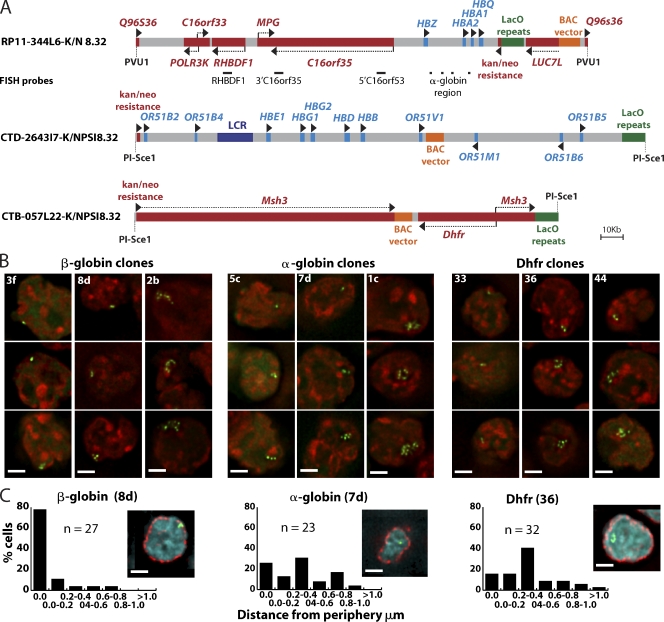
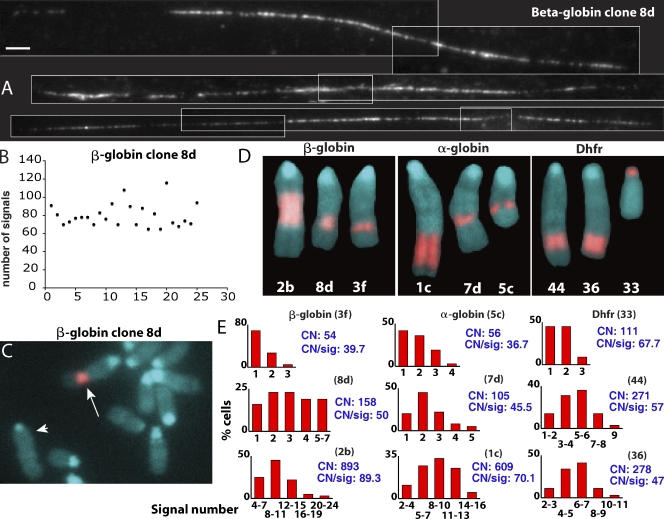
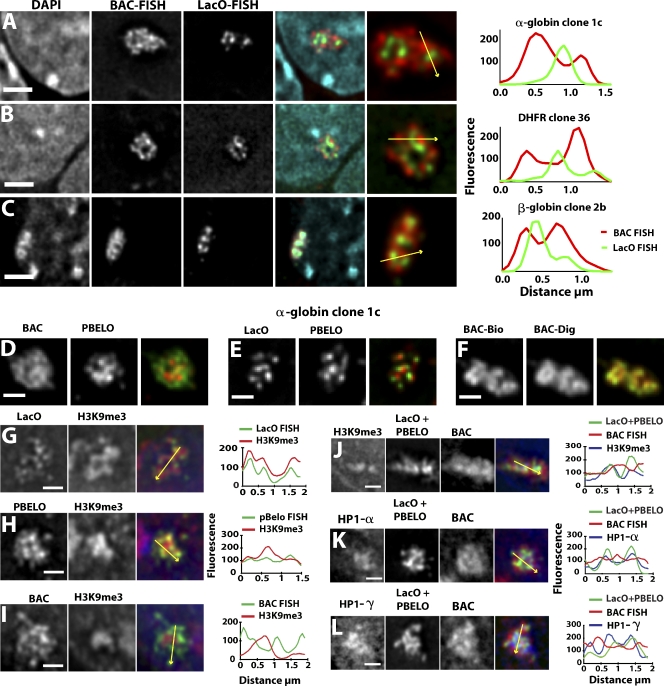
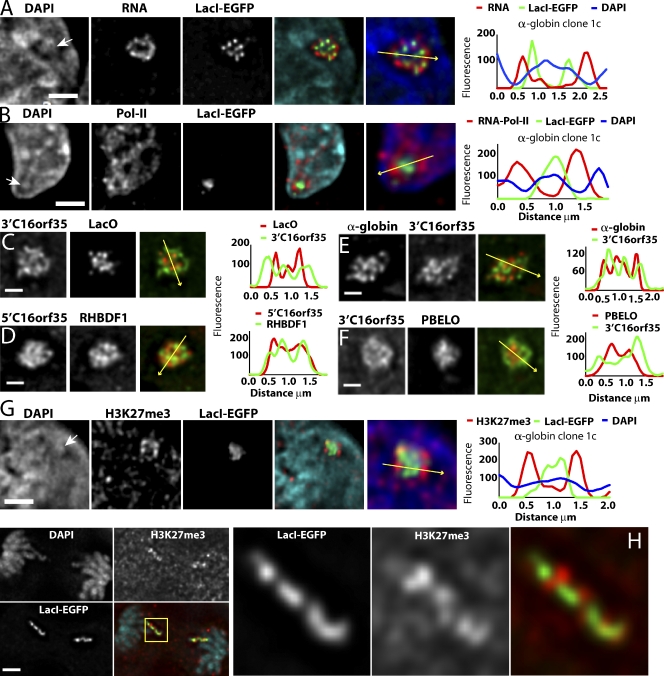
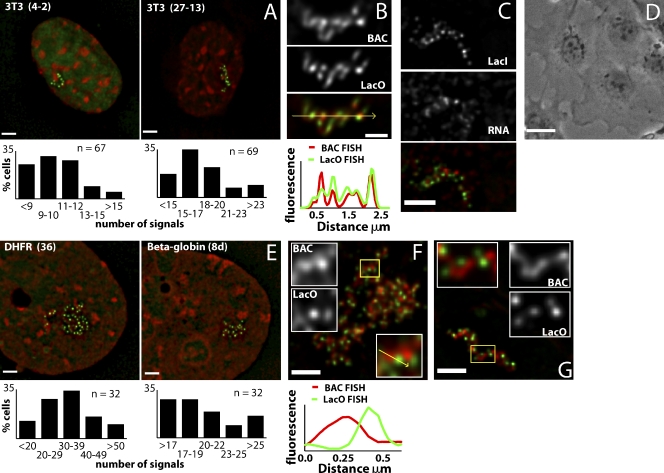
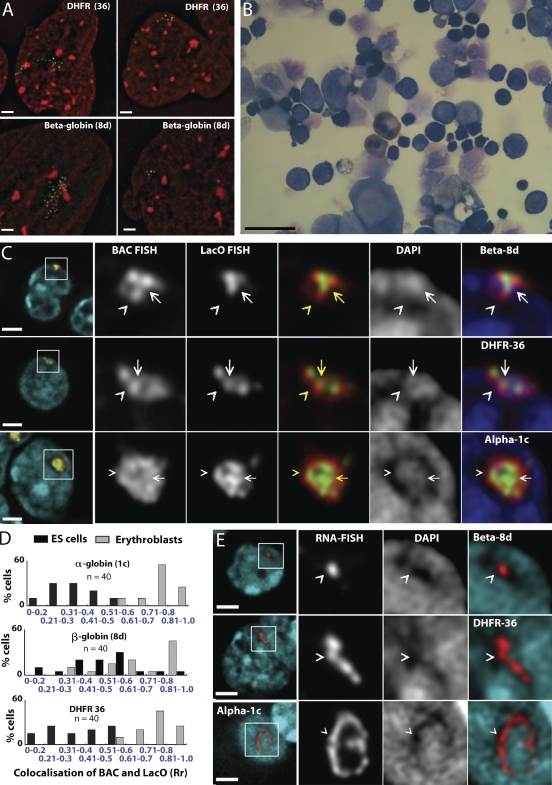
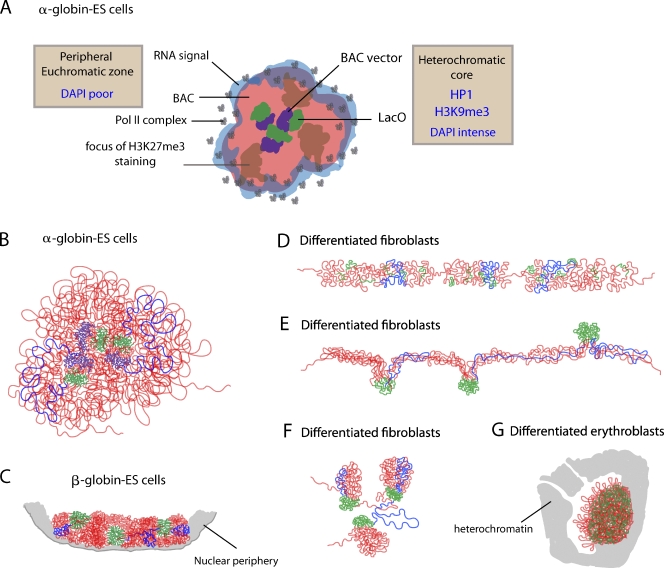
Interphase chromatin compaction well above the 30-nm fiber is well documented, but the structural motifs underlying this level of chromatin folding remain unknown. Taking a reductionist approach, we analyzed in mouse embryonic stem (ES) cells and ES-derived fibroblasts and erythroblasts the folding of 10-160-megabase pair engineered chromosome regions consisting of tandem repeats of bacterial artificial chromosomes (BACs) containing approximately 200 kilobases of mammalian genomic DNA tagged with lac operator (LacO) arrays. Unexpectedly, linear mitotic and interphase chromatid regions formed from noncontiguously folded DNA topologies. Particularly, in ES cells, these model chromosome regions self-organized with distant sequences segregating into functionally distinct, compact domains. Transcriptionally active and histone H3K27me3-modified regions positioned toward the engineered chromosome subterritory exterior, with LacO repeats and the BAC vector backbone localizing within an H3K9me3, HP1-enriched core. Differential compaction of Dhfr and alpha- and beta-globin transgenes was superimposed on dramatic, lineage-specific reorganization of large-scale chromatin folding, demonstrating a surprising plasticity of large-scale chromatin organization.


Figures

Figure 1.
Figure 1.
Construction and initial characterization of BAC transgenes. (A) BAC diagrams show positions of genes, regulatory elements, transposons with LacO arrays, vector sequences, and FISH probes (red, active genes; light blue, genes inactive in ES cells). (B) Deconvolved optical sections of EGFP-LacI signals (green) counterstained with DAPI (red) in different transgenic ES cell lines. (C) Deconvolved optical sections of EGFP-LacI (green), anti–nuclear pore immunostaining (red), and DAPI DNA staining (blue). Histograms of the shortest distances between EGFP-LacI spots and the nuclear periphery for one clone of each BAC type. Bars, 2 µm.
Figure 2.
Figure 2.
Transgene copy number estimation. (A) Fiber FISH examples from β-globin clone 8d hybridized with LacO sequences. White lines outline individual images assembled into montages. Bar, 2 µm. (B) Scatter plot showing LacO fiber FISH signal numbers (y axis) in different fiber FISH examples (x axis) for β-globin clone 8d. Variation in signal numbers was related to incomplete stretching, with the maximum signal number used for copy number estimation. (C and D) DAPI (blue) and FISH BAC probe (red) are shown. (C) Partial metaphase spread from β-globin clone 8d, BAC transgene insertion (arrow), longest mouse chromosome used for normalization (arrowhead; see Results). (D) Metaphase chromosomes showing BAC insert size and location for each cell clone selected for further analysis. (E) Histograms showing number of EGFP-LacI signals (x axis) counted in maximum intensity projections of 64 interphase nuclei from each cell clone. Copy number estimates (CN) and mean copy number per GFP signal (CN/sig) are shown in blue.
Figure 3.
Figure 3.
Positions of LacO and BAC vector sequences relative to other BAC sequences. (A–C) 3D FISH with LacO (green), BAC probes (red), DAPI (blue) for α-globin clone 1c (A), Dhfr clone 36 (B), and β-globin clone 2b (C). (right) Intensity line scans along arrows are plotted. Bars, 2 µm. (D–F) 3D FISH for α-globin clone 1c BAC transgenes hybridized with BAC (green) and PBELO BAC vector backbone (red) probes (D), LacO (green) and PBELO probes (red; E), the same BAC probe labeled with biotin (BAC-Bio; red), or digoxigenin (BAC-Dig; green; F). (G–I) Immuno-3D FISH for α-globin clone 1c BAC transgenes with LacO probe (green) versus H3K9me3 staining (red; G), PBELO vector backbone probe (green) versus H3K9me3 staining (red; H), and BAC probe (green) versus H3K9me3 staining (red; I). (J–L) Three-color immuno-3D FISH with a combined LacO and PBELO vector backbone probe (green), BAC probe (red), and immunostaining (blue) against H3K9me3 (J), HP1-α (K), or HP1-γ (L). (right) Intensity line scans along arrows are plotted. Bars, 1 µm.
Figure 4.
Figure 4.
Peripheral versus interior distribution of transcripts, RNA polymerase II, active versus inactive gene sequences, vector backbone, and LacO repeats relative to BAC transgene territory. (A–H) Undifferentiated, α-globin clone 1c ES cells (DAPI; blue). (right) Intensity line plots along yellow arrows are shown. (A) RNA FISH shows peripheral distribution of BAC transcripts (red) relative to EGFP-LacI spots (green). (B) RNA polymerase II immunostaining (red) relative to EGFP-LacI spots (green). (C–F) 3D DNA FISH are shown. (C) 3′ region of C16orf35 gene (green) and LacO probes are shown (red). (D) 5′ region of C16orf35 (red) and RHBDF1 (green) gene probes are shown. (E) Inactive α-globin region (red) versus active C16orf35 (green) probes are shown. (F) 3′ region of C16orf35 gene (green) versus BAC vector backbone (red) probes are shown. (G and H) Anti-H3K27me3 immunostaining (red) versus EGFP-LacI (green) in interphase (G) versus anaphase nuclei (H). (H) Boxed region indicates region magnified on the right. White arrows mark DAPI-dense regions underlying LacI signals. Bars: (A, B, G, and H) 2 µm; (C–F) 1 µm.
Figure 5.
Figure 5.
Different organization of BAC transgenes in fibroblasts. (A) 3T3 Dhfr BAC clones 4–2 (left) or 27–13 (right) are shown for EGFP-LacI (green) and DAPI (red). (bottom) Histograms show numbers of EGFP-LacI signals in nuclear maximum intensity projections (n = 67–69). (B) 3D DNA FISH using whole BAC (red) or LacO (green) probes in 3T3 clone 27–13. (bottom) Signal intensities along the arrow are shown. (C) 3T3 clone 27–13 for BAC RNA FISH (red) and EGFP-LacI (green). (D) ES cells differentiated to fibroblast-like cells (phase contrast). (E) ES clones Dhfr 36 (left) or β-globin 8d (right) differentiated to fibroblast-like cells for EGFP-LacI (green) and DAPI (red). Histograms show numbers of EGFP-LacI signals in maximum intensity projections. (F) 3D DNA FISH using BAC (red) or LacO (green) probes on fibroblast-like cells differentiated from ES Dhfr clone 36. Clusters of similar-size units show segregation of BAC and LacO sequences. Enlargement of individual units (of yellow boxed area) and intensity line drawing (bottom) shows the spatial distribution of BAC and LacO signals with relative fluorescence intensity along arrow. (G) 3D DNA FISH on fibroblast-like cells differentiated from ES β-globin clone 8d using BAC (red) and LacO (green) probes. LacO foci are offset from the central axis of a continuous fiber formed by BAC sequence. Enlargements of the yellow boxed area show a segment of fiber-like structure. DAPI counterstaining in E has been γ processed (factor of 0.7) to enhance chromatin substructure. Bars: (B) 1 µm; (D) 25 µm; (A, C, and E–G) 2 µm.
Figure 6.
Figure 6.
Transgene conformation in RA-differentiated and erythroid cells. (A) High GFP spot number, linear fibroblast-like (left) versus low GFP spot number, compact ES-like (right) BAC conformations in RA-differentiated Dhfr 36 or β-globin 8d cells (red, DAPI; green, GFP-LacI) (B) Erythroblasts derived from ES cells after 13 d of differentiation (May-Giemsa staining). (C) 3D DNA FISH of transgene arrays in ES clones β-globin 8d, Dhfr 36, and α-globin1c cells after differentiation to erythroblasts: DAPI (blue), LacO (green), and BAC probes (red). Whole cells are shown in first left panels with enlargements (marked by white boxes) in right panels. Fringes of BAC signals (carets) overlap the edges of DAPI-poor regions but not LacO signal. Overlapping BAC and LacO signals coincide with high-intensity DAPI staining (arrows). (D) Histograms showing degree of colocalization of LacO and BAC FISH signals in individual cells (as measured by Pearson’s correlation coefficients [Rr]) before (black) or after (gray) differentiation to erythroblasts. Dhfr and α-globin BAC transgenes show clear transition from low to high overlap during differentiation. (E) RNA FISH BAC (red) signal and DAPI (blue) in clones β-globin 8d, Dhfr 36, and α-globin 1c after erythroid differentiation. (right) Enlargements of the boxed areas (left) show that RNA signals (carets) coincide with DAPI-poor regions. DAPI signal in A has been γ processed (factor of 0.7). Bars: (A, C, and E) 2 µm; (B) 20 µm.
Figure 7.
Figure 7.
Summary of BAC transgene conformations in ES and differentiated cells. (A) Cartoon showing spatial segregation of DNA sequences and nascent transcripts relative to distributions of HP1, H3K9me3, H3K27me3, and RNA polymerase II within α-globin BAC transgene arrays in ES cells. (B–G) Models for changes in DNA topology within BAC transgene arrays as a function of cell differentiation: LacO repeats (green), BAC vector sequence (purple), and remainder of the BAC (red) are shown, with blue lines tracing the path of a single BAC copy.

References

    1. Agard D.A., Hiraoka Y., Shaw P., Sedat J.W. 1989. Fluorescence microscopy in three dimensions. Methods Cell Biol. 30:353–377 10.1016/S0091-679X(08)60986-3 - DOI - PubMed
    1. Assaad F.F., Tucker K.L., Signer E.R. 1993. Epigenetic repeat-induced gene silencing (RIGS) in Arabidopsis. Plant Mol. Biol. 22:1067–1085 10.1007/BF00028978 - DOI - PubMed
    1. Beatty B.G., Scherer S.W. 2002. Human chromosome mapping of single copy genes. FISH: A Practical Approach. Beatty B., Mai S., Squire J., Oxford University Press, Oxford: 29–53
    1. Belmont A.S. 2002. Mitotic chromosome scaffold structure: new approaches to an old controversy. Proc. Natl. Acad. Sci. USA. 99:15855–15857 10.1073/pnas.262672799 - DOI - PMC - PubMed
    1. Belmont A.S., Bruce K. 1994. Visualization of G1 chromosomes: a folded, twisted, supercoiled chromonema model of interphase chromatid structure. J. Cell Biol. 127:287–302 10.1083/jcb.127.2.287 - DOI - PMC - PubMed

Publication types