. 2010 Nov 12;285(46):35866-77.
doi: 10.1074/jbc.M110.167189. Epub 2010 Sep 6.

Liver cytochrome P450 3A ubiquitination in vivo by gp78/autocrine motility factor receptor and C terminus of Hsp70-interacting protein (CHIP) E3 ubiquitin ligases: physiological and pharmacological relevance

Affiliations

Liver cytochrome P450 3A ubiquitination in vivo by gp78/autocrine motility factor receptor and C terminus of Hsp70-interacting protein (CHIP) E3 ubiquitin ligases: physiological and pharmacological relevance

Sung-Mi Kim et al. J Biol Chem. .

Abstract

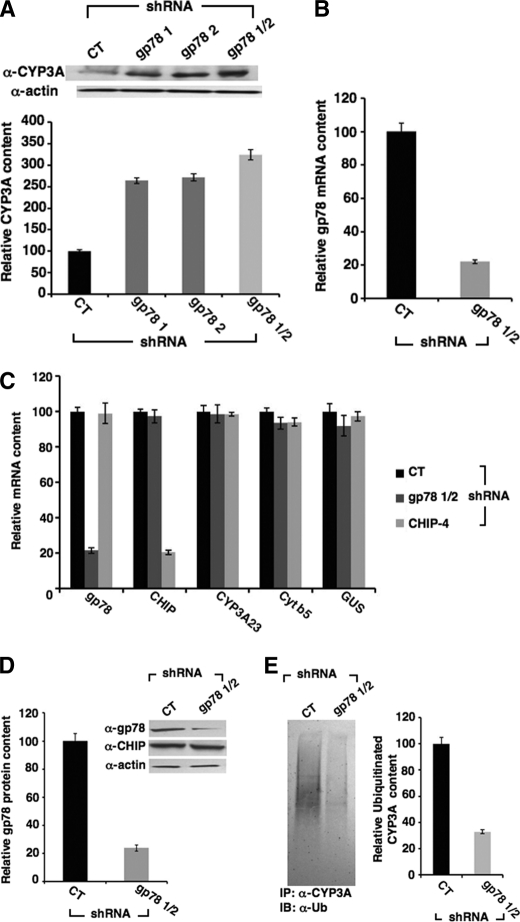
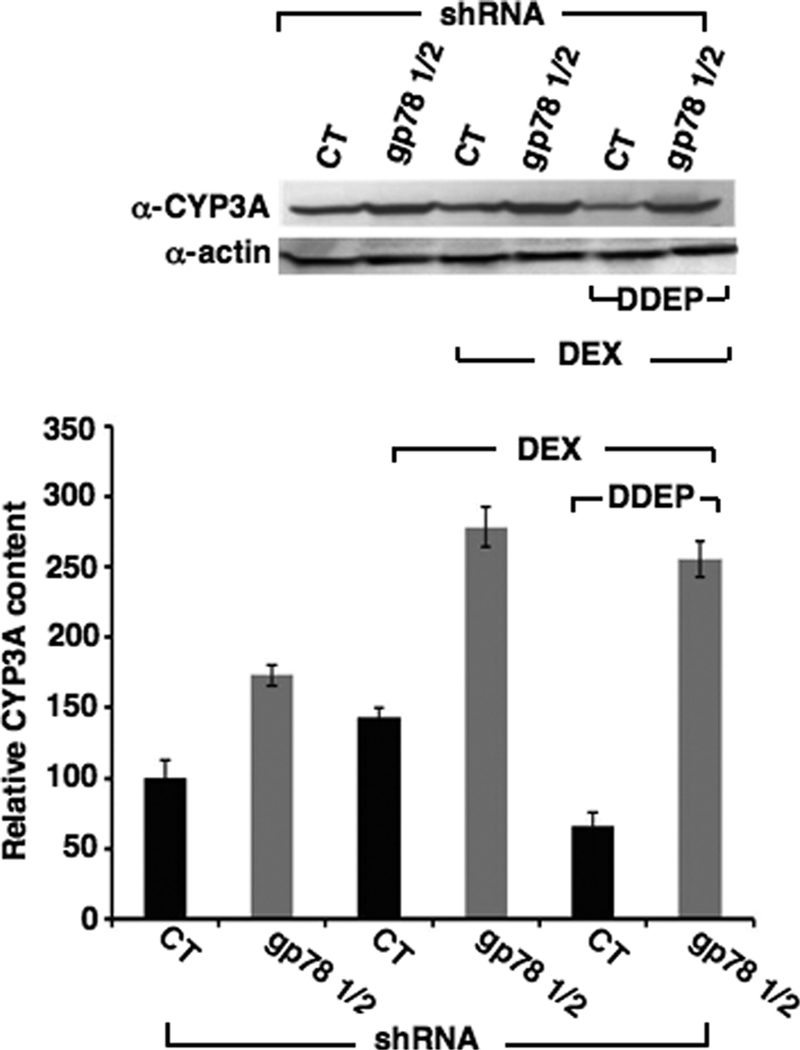
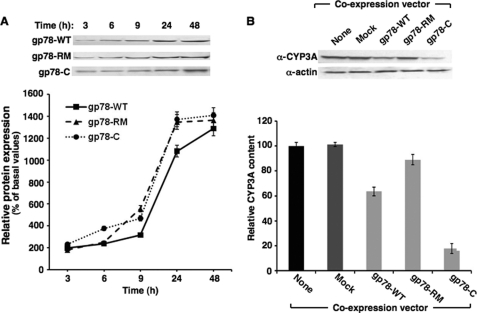
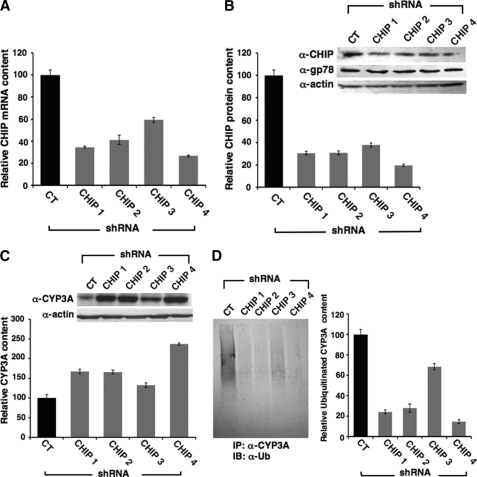
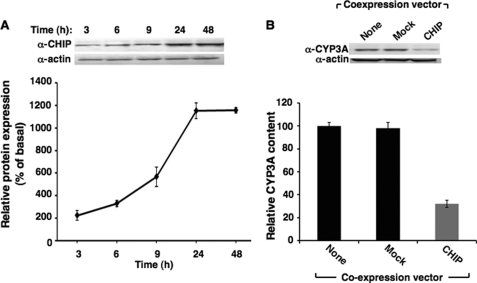
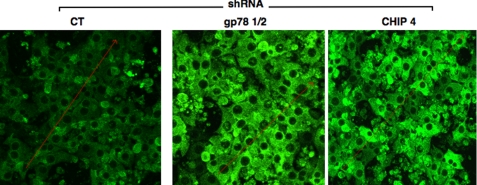
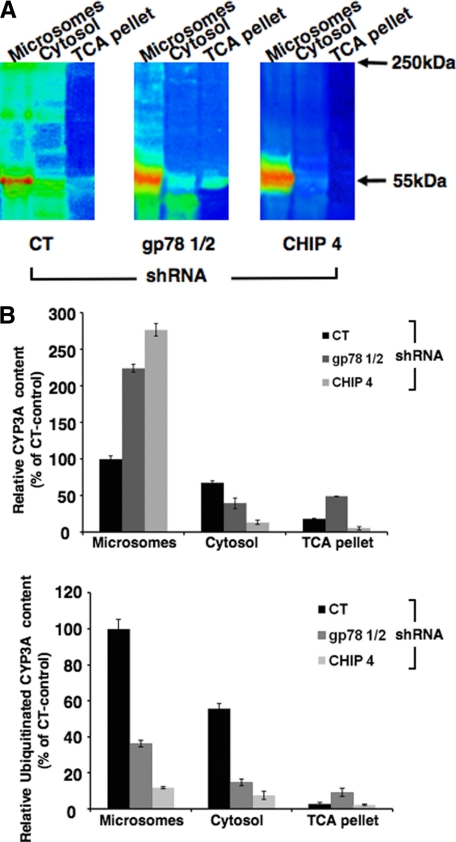
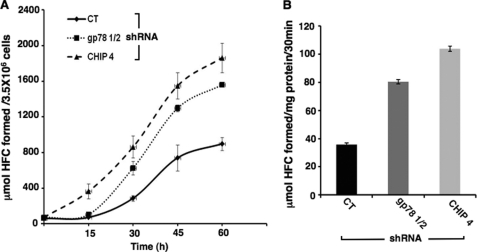
CYP3A4 is a dominant human liver cytochrome P450 enzyme engaged in the metabolism and disposition of >50% of clinically relevant drugs and held responsible for many adverse drug-drug interactions. CYP3A4 and its mammalian liver CYP3A orthologs are endoplasmic reticulum (ER)-anchored monotopic proteins that undergo ubiquitin (Ub)-dependent proteasomal degradation (UPD) in an ER-associated degradation (ERAD) process. These integral ER proteins are ubiquitinated in vivo, and in vitro studies have identified the ER-integral gp78 and the cytosolic co-chaperone, CHIP (C terminus of Hsp70-interacting protein), as the relevant E3 Ub-ligases, along with their cognate E2 Ub-conjugating enzymes UBC7 and UbcH5a, respectively. Using lentiviral shRNA templates targeted against each of these Ub-ligases, we now document that both E3s are indeed physiologically involved in CYP3A ERAD/UPD in cultured rat hepatocytes. Accordingly, specific RNAi resulted in ≈80% knockdown of each hepatic Ub-ligase, with a corresponding ≈2.5-fold CYP3A stabilization. Surprisingly, however, such stabilization resulted in increased levels of functionally active CYP3A, thereby challenging the previous notion that E3 recognition and subsequent ERAD of CYP3A proteins required ab initio their structural and/or functional inactivation. Furthermore, coexpression in HepG2 cells of both CYP3A4 and gp78, but not its functionally inactive RING-finger mutant, resulted in enhanced CYP3A4 loss greater than that in corresponding cells expressing only CYP3A4. Stabilization of a functionally active CYP3A after RNAi knockdown of either of the E3s, coupled with the increased CYP3A4 loss on gp78 or CHIP coexpression, suggests that ERAD-associated E3 Ub-ligases can influence clinically relevant drug metabolism by effectively regulating the physiological CYP3A content and consequently its function.


Figures

FIGURE 1.
FIGURE 1.
Effects of RNAi-mediated gp78 knockdown on CYP3A content in cultured rat hepatocytes. Effects are shown of shRNA-1 and shRNA-2 targeted against hepatic gp78, individually or in combination (gp78 1/2), on hepatic CYP3A content derived from each shRNA-infected cell culture. Hepatocytes were infected with shRNA-1, shRNA-2, shRNA-1 + shRNA-2 (gp78 1/2) directed against hepatic gp78, or an shRNA containing a sequence known not to target any known rat gene (CT) and then treated with the CYP3A inducer Dex. A, a representative example of CYP3A Western immunoblotting analyses of these hepatocyte lysates (50 μg of protein) is shown at the top, with corresponding aliquots used for actin immunoblotting analyses as loading controls. Densitometric quantification of hepatic CYP3A content from three individual experiments is shown at the bottom. Statistical analyses revealed significant differences in hepatic CYP3A content between CT and shRNA-1-, shRNA-2-, or shRNA gp78 1/2-infected cells at p < 0.01. No statistically significant differences were observed between shRNA 1- or shRNA 2-infected cells. B, the effects of gp78 shRNA 1/2 on hepatic gp78 mRNA. C, evidence of the target specificity of gp78 shRNA 1/2 against gp78 mRNA and that of CHIP-4 shRNA against CHIP mRNA by qRT-PCR analyses are documented. D, a representative example of gp78 Western immunoblotting analyses of these hepatocyte lysates (50 μg of protein) is shown at the top, with corresponding aliquots used for actin immunoblotting analyses as loading controls. Densitometric quantification of hepatic gp78 content from three individual experiments is shown at the bottom. Statistical analyses revealed significant differences in hepatic gp78 content between CT and shRNA gp78 1/2-infected cells at p < 0.01. E, effects of gp78 shRNA 1/2 on hepatic ubiquitinated CYP3A species, detected after ubiquitin immunoblotting (IB) analyses of CYP3A immunoprecipitates (IP) derived from each shRNA-infected cell culture are shown. Densitometric quantification of hepatic ubiquitinated CYP3A (area between 65 kDa and top of the gel) from three individual experiments is shown at the right. Statistical analyses revealed significant differences in hepatic CYP3A content between CT and shRNA gp78 1/2-infected cells at p < 0.01.
FIGURE 2.
FIGURE 2.
Stabilization of native constitutive, Dex-inducible, and DDEP-inactivated CYP3A content in cultured rat hepatocytes following RNAi-mediated gp78 knockdown. Hepatocytes were infected with shRNA gp78 1/2 or the control shRNA (CT). Combined effects of shRNA gp78 1/2 on hepatic CYP3A content of untreated (first 2 lanes) and Dex-pretreated hepatocytes (next 4 lanes) are shown. Some of the Dex-pretreated cultures were also treated with DDEP, a mechanism-based CYP3A inactivator for 6 h (last 2 lanes). A representative example of CYP3A Western immunoblotting analyses of these hepatocyte lysates (50 μg of protein) is shown at the top, with corresponding aliquots used for actin immunoblotting analyses as the loading controls. Densitometric quantification of hepatic CYP3A content from three individual experiments is shown at the bottom. Statistical analyses revealed significant differences in hepatic CYP3A content between CT and corresponding shRNA gp78 1/2-infected cells at p < 0.01.
FIGURE 3.
FIGURE 3.
Effects of coexpression of CYP3A4 and gp78 in cultured HepG2 cells. A, HepG2 cells were grown to confluence and then co-infected with a vector expressing CYP3A4 and a vector expressing full-length functionally active gp78 (gp78-WT), its RING-finger mutant (gp78-RM), or just its ER membrane anchor-deleted C-terminal domain (gp78-C) for 0–48 h. The time course of the densitometrically quantified gp78 protein in cells expressed by each of these vectors is shown. B, HepG2 cells coexpressing CYP3A4 and a vector expressing gp78-WT, its inactive gp78-RM, or gp78-C and harvested at 48 h are shown. Control HepG2 cells expressing just CYP3A4 by itself (no coexpression vector) or along with the empty vector (Mock) were cultured in parallel. A representative example of CYP3A Western immunoblotting analyses of these hepatocyte lysates (30 μg of protein) is shown at the top, with corresponding aliquots used for actin immunoblotting analyses as the loading controls. Densitometric quantification of hepatic CYP3A content (mean ± S.D.) from three individual experiments is shown at the bottom. Statistical analyses revealed significant differences in hepatic CYP3A4 content of cells expressing CYP3A4 alone and corresponding gp78-WT or gp78-C expressing cells at p < 0.01. Significant differences were also observed in the CYP3A4 content of gp78-WT- or gp78-C-expressing cells and those expressing gp78-RM at p < 0.01, and between the CYP3A4 content of gp78-WT and gp78-C expressing cells at p < 0.01. No significant differences in CYP3A4 content were observed between cells expressing CYP3A4 alone (None) and cells expressing the empty vector (Mock).
FIGURE 4.
FIGURE 4.
Effects of RNAi-mediated CHIP knockdown on CYP3A content in cultured rat hepatocytes. Hepatocytes were infected with shRNA templates CHIP-1, CHIP-2, CHIP-3, or CHIP-4 targeted against various exons of the rat CHIP gene or the control shRNA template (CT) and then treated with the CYP3A inducer Dex. Individual effects of shRNAs CHIP-1–4 on hepatic CHIP mRNA (A) and CHIP protein content (B) are shown. B, a representative example of CHIP Western immunoblotting analyses of these hepatocyte lysates (50 μg of protein) is shown at the top, with corresponding aliquots used for actin immunoblotting analyses as loading controls. Densitometric quantification of hepatic CHIP content from three individual experiments is shown at the bottom. Statistical analyses revealed significant differences in hepatic CHIP content between CT and cells infected with each CHIP-shRNA at p < 0.01. C, individual effects of shRNAs CHIP-1–4 on hepatic CYP3A content derived from each shRNA-infected cell culture are shown. A representative example of CYP3A Western immunoblotting analyses of these hepatocyte lysates (50 μg of protein) is shown at the top, with corresponding aliquots used for actin immunoblotting analyses as loading controls. Densitometric quantification of hepatic CYP3A content (mean ± S.D.) from three individual experiments is shown at the bottom. Statistical analyses revealed significant differences in hepatic CYP3A content between CT and shRNA CHIP-1, CHIP-2, CHIP-3, and CHIP-4 at p < 0.01, p < 0.01, p < 0.01, and p < 0.01, respectively. No statistically significant differences were observed between CHIP-1- or CHIP-2-infected cells. D, individual effects of shRNAs CHIP-1–4 on hepatic ubiquitinated CYP3A species are indicated, as detected after Ub immunoblotting (IB) analyses of CYP3A immunoprecipitates (IP) derived from each shRNA-infected cell culture. Densitometric quantification of hepatic ubiquitinated CYP3A (area between 65 kDa and top of the gel) from three individual experiments is shown at the right. Statistical analyses revealed significant differences in hepatic CYP3A content between CT and shRNA CHIP-1, CHIP-2, CHIP-3, and CHIP-4-infected cells at p < 0.05, p < 0.01, p < 0.01 and p < 0.01, respectively.
FIGURE 5.
FIGURE 5.
Effects of coexpression of CYP3A4 and CHIP in cultured HepG2 cells. A, HepG2 cells were grown to confluence and then co-infected with expression vectors for CYP3A4 and CHIP for 0–48 h. The time course of the densitometrically quantified CHIP protein expressed by the CHIP vector is shown. B, HepG2 cells coexpressing CYP3A4 and CHIP vectors and harvested at 48 h are shown. Control HepG2 cells expressing just CYP3A4 by itself (no coexpression vector (None)) or along with the empty vector (Mock) were cultured in parallel. A representative example of CYP3A Western immunoblotting analyses of these hepatocyte lysates (30 μg of protein) is shown at the top, with corresponding aliquots used for actin immunoblotting analyses as the loading controls. Densitometric quantification of hepatic CYP3A content (mean ± S.D.) from three individual experiments is shown at the bottom. Statistical analyses revealed significant differences in hepatic CYP3A4 content between cells expressing CYP3A4 by itself and corresponding CHIP-expressing cells at p < 0.01. No significant differences in hepatic CYP3A4 content were observed between cells expressing CYP3A4 by itself and those expressing the empty vector (mock).
FIGURE 6.
FIGURE 6.
RNAi-mediated gp78 or CHIP knockdown with in situ verification of CYP3A stabilization in cultured rat hepatocytes by confocal immunofluorescence microscopy. Rat hepatocyte cultures were infected with CT shRNA, shRNA gp78 1/2, or shRNA CHIP-4 for 7 days. shRNA-infected rat hepatocyte cultures were fixed and stained with antibodies to CYP3A (green). Data from a representative experiment showing CYP3A accumulation are shown.
FIGURE 7.
FIGURE 7.
Relative intracellular localization of parent and ubiquitinated HMM CYP3A species after gp78 or CHIP RNAi in cultured hepatocytes. Rat hepatocyte cultures were infected with CT shRNA, shRNA gp78 1/2, or shRNA CHIP-4 for 7 days. On the 8th day, they were subjected to 35S-pulse-chase analyses. Two h after cold chase, cells were harvested, and homogenates were subfractionated into cytosol and microsomes. CYP3A immunoprecipitates (45 μl) from the cytosol, sodium carbonate-washed microsomes, and a trichloroacetic acid (TCA) pellet derived from the sodium carbonate wash were obtained as described under “Experimental Procedures” and subjected to SDS-PAGE analyses. The gels were dried and then exposed to PhophorImaging screens and visualized using a Typhoon scanner. A, a typical SDS-polyacrylamide gel is shown as a representative of corresponding CYP3A immunoprecipitates from pooled hepatocyte cultures. B, the relative [35S]-CYP3A intensity of the parent CYP3A (55-kDa band) and the ubiquitinated CYP3A species between 65 and 250 kDa in each lane were quantified using ImageQuant software. Values are mean ± S.D. of three individual determinations. The color wheel intensity code is as follows: white > magenta > red > orange > yellow > green > light blue > dark blue > black.
FIGURE 8.
FIGURE 8.
Functional relevance of hepatic CYP3A stabilization after gp78 or CHIP RNAi. Rat hepatocyte cultures were infected with the control shRNA, shRNA gp78 1/2, or shRNA CHIP-4 for 7 days. On the 7th day, the functional activity of CYP3A was assayed in intact hepatocytes or microsomal preparations isolated from these cells by assessing their ability to catalyze the 7-O-debenzylation of BFC, a diagnostic CYP3A functional probe, to HFC. A, the time course of HFC formation (μmol of HFC formed/3.5 × 106 cells) in the medium is assayed following treatment with β-glucuronidase + arylsulfatase to convert any in vivo conjugated HFC metabolites to the free unconjugated HFC species. The time course includes experimental values (mean ± S.D.) from three individual experiments. Statistical analyses revealed significant differences in hepatic CYP3A function between CT and shRNA gp78 1/2 or CHIP-4-infected cells at p < 0.05 and p < 0.01, respectively. Statistically significant differences in hepatic CYP3A function between shRNA gp78 1/2- and shRNA CHIP-4-infected cells were also observed at p < 0.01. B, values for HFC formation (μmol of HFC formed/mg of protein/30 min) in BFC assays catalyzed by microsomes derived from CT, shRNA gp78 1/2- or CHIP-4-infected cells are also shown. Statistical analyses revealed significant differences in hepatic CYP3A function between CT and shRNA gp78 1/2- and CHIP-4-infected cells at p < 0.01 and p < 0.01, respectively. Statistically significant differences in hepatic CYP3A function between shRNA gp78 1/2- and shRNA CHIP-4-infected cell microsomes were also observed at p < 0.01.

Similar articles

Cited by

References

    1. Guengerich F. P. (2005) in Cytochrome P450: Structure, Mechanism and Biochemistry (Ortiz de Montellano P. ed) pp. 377–530, Kluwer-Academic/Plenum Press, New York
    1. Correia M. A., Decker C., Sugiyama K., Caldera P., Bornheim L., Wrighton S. A., Rettie A. E., Trager W. F. (1987) Arch. Biochem. Biophys. 258, 436–451 - PubMed
    1. Correia M. A., Davoll S. H., Wrighton S. A., Thomas P. E. (1992) Arch. Biochem. Biophys. 297, 228–238 - PubMed
    1. Faouzi S., Medzihradszky K. F., Hefner C., Maher J. J., Correia M. A. (2007) Biochemistry 46, 7793–7803 - PMC - PubMed
    1. Wang H. F., Figueiredo Pereira M. E., Correia M. A. (1999) Arch. Biochem. Biophys. 365, 45–53 - PubMed

Publication types

MeSH terms

LinkOut - more resources