. 2010 Oct;117(4):1113-43.
doi: 10.1037/a0020311.

Neurally constrained modeling of perceptual decision making

Affiliations

Neurally constrained modeling of perceptual decision making

Braden A Purcell et al. Psychol Rev. 2010 Oct.

Erratum in

  • Psychol Rev. 2010 Oct;117(4):following 1143
  • Psychol Rev. 2011 Jan;118(1):134
  • Psychol Rev. 2011 Jan;118(1):96

Abstract

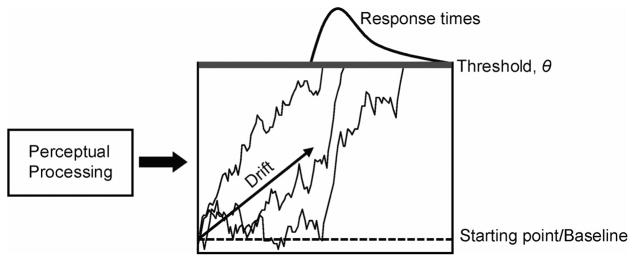
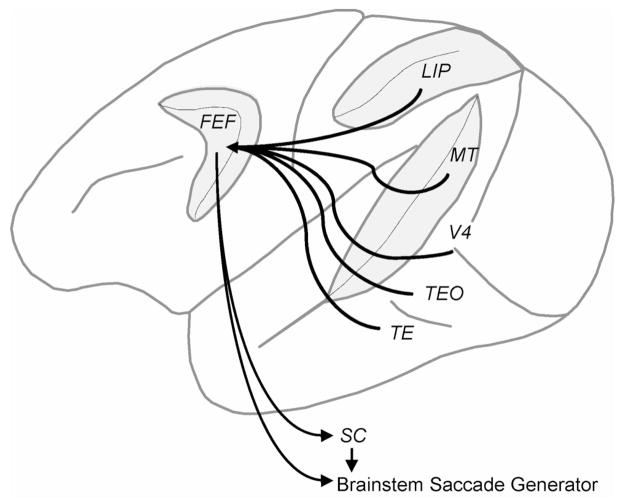
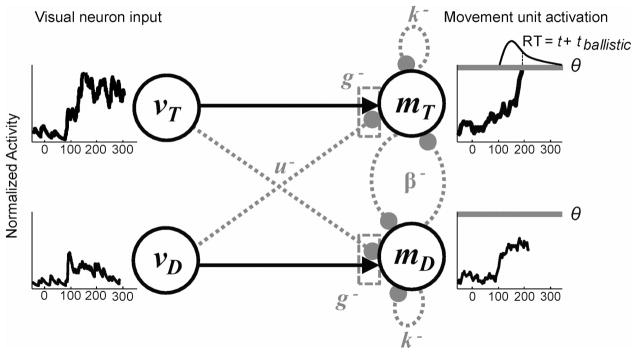
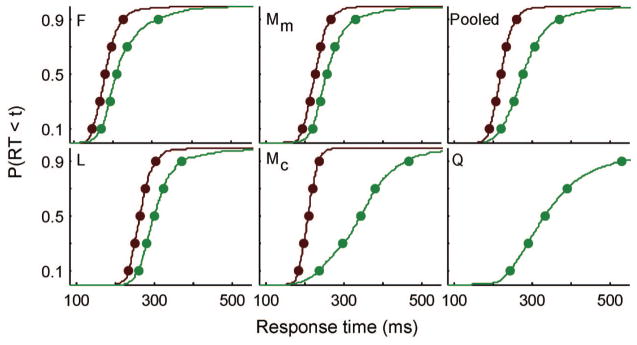
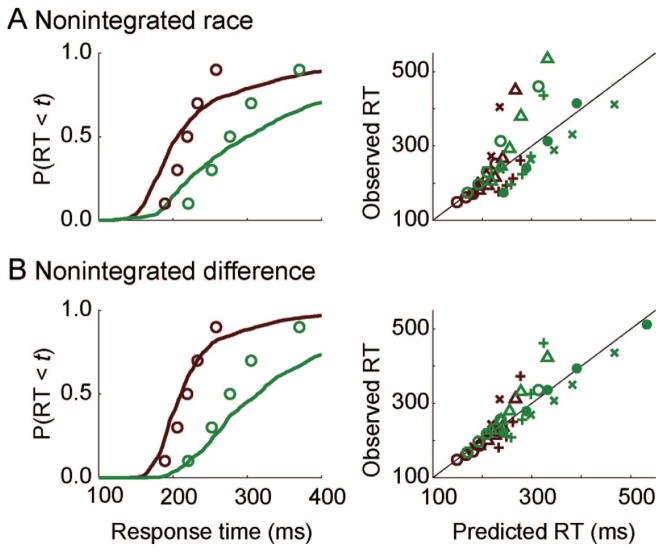
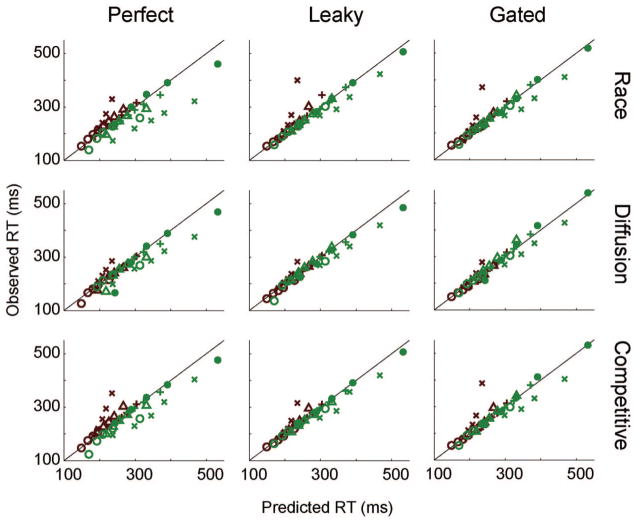
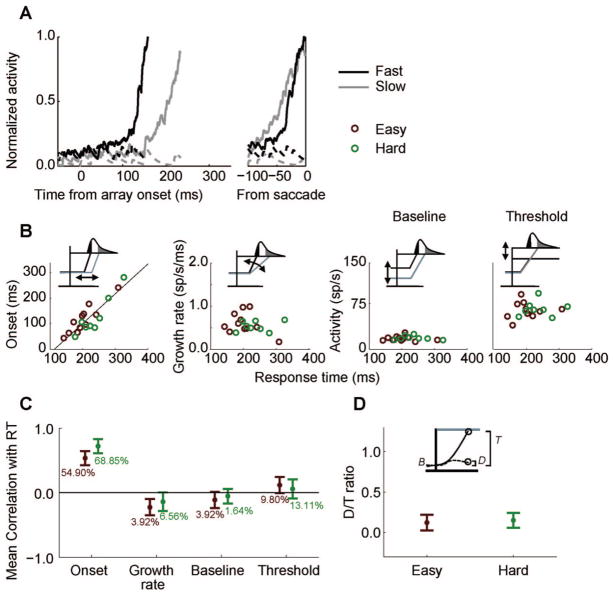
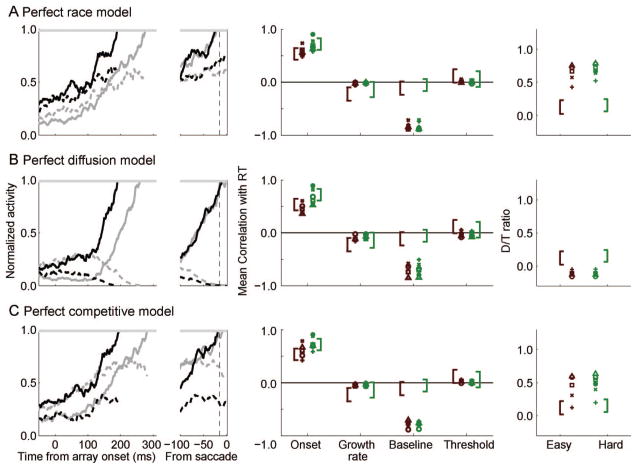
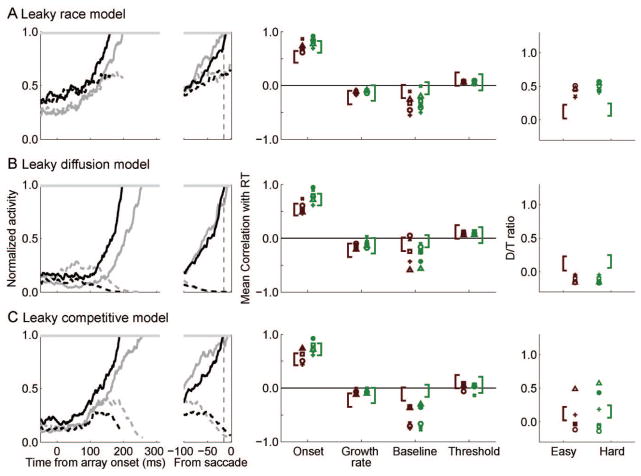
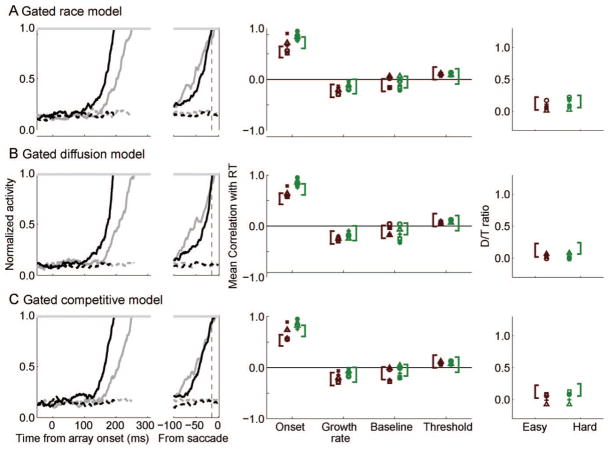
Stochastic accumulator models account for response time in perceptual decision-making tasks by assuming that perceptual evidence accumulates to a threshold. The present investigation mapped the firing rate of frontal eye field (FEF) visual neurons onto perceptual evidence and the firing rate of FEF movement neurons onto evidence accumulation to test alternative models of how evidence is combined in the accumulation process. The models were evaluated on their ability to predict both response time distributions and movement neuron activity observed in monkeys performing a visual search task. Models that assume gating of perceptual evidence to the accumulating units provide the best account of both behavioral and neural data. These results identify discrete stages of processing with anatomically distinct neural populations and rule out several alternative architectures. The results also illustrate the use of neurophysiological data as a model selection tool and establish a novel framework to bridge computational and neural levels of explanation.


Figures

Figure 1
Figure 1
Stochastic accumulator model illustration.
Figure 2
Figure 2
Connectivity between visual cortical areas and the oculomotor system. Middle temporal (MT), visual area V4, visual area TEO, visual area TE, and lateral intraparietal area (LIP) project to the frontal eye field (FEF). LIP and FEF project to the superior colliculus (SC). FEF and SC project to the brainstem saccade generator. Not pictured are connections between prefrontal cortex and FEF, from LIP to SC, and from the substantia nigra pars reticulata of the basal ganglia to SC and to FEF via the mediodorsal nucleus of the thalamus.
Figure 3
Figure 3
Saccade visual search task and frontal eye field (FEF) activity during search. Panel A illustrates example stimulus arrays used for color search (top), motion search (middle; arrows indicate direction of motion), and form search (bottom). The color and motion search included a manipulation of target–distractor similarity, with an example of easy on the left and hard on the right. The form search included only one difficulty condition. Right panels show examples of FEF visual (Panel B) and movement (Panel C) neuron activity during visual search. Easy trials are shown in red, hard trials are shown in green. Solid lines are trials in which the target was in the visual neuron’s receptive field or movement neuron’s movement field, and dashed lines are trials in which the target was outside the neurons’ response fields.
Figure 4
Figure 4
Simulation methods. Spike trains were recorded from frontal eye field visual neurons during a saccade search task. Trials were sorted into two populations according to whether the target (top) or distractors (bottom) were within the neuron’s response field. N spike trains were randomly sampled from each population to generate a normalized activation function that served as model input on a given simulated trial.
Figure 5
Figure 5
General model architecture. Two visual units represent activity when a target is in the neuron’s receptive field, vT, and when a distractor is in the neuron’s response field, vD. The activity of the visual units (far left) on a trial is determined from samples of neural activity as shown in Figure 4. Visual neuron activity serves as input to movement units representing a saccade to the target, mT, and distractor, mD. Models were defined by setting parameters equal to zero to eliminate connections shown in dashed grey (see text for details). RT = response time.
Figure 6
Figure 6
Observed behavioral data. Cumulative distribution of correct response times (RTs). RTs from easy trials are red, hard are green. Each panel indicates a different data set. Monkey F (color search), L (motion search), M (Mc = color, Mm = motion search), pooled (Vincentized RT distribution from F, L, and M), and Q (form search).
Figure 7
Figure 7
Behavioral predictions of the nonintegrated models. Panel A shows the fits of the nonintegrated race model. Panel B shows the fits of the nonintegrated difference model. Left panels show the predicted cumulative response time (RT) distributions for the pooled data set (solid lines) with observed 10th, 30th, 50th, 70th, and 90th percentiles (open circles). Easy is red, hard is green. Right panels show scatterplots of observed versus predicted quantiles for individual data sets for easy and hard, Monkey F = ○, L = +, Mm = Δ, Mc = x, and Q = ●.
Figure 8
Figure 8
Behavioral predictions of the perfect (left panels), leaky (middle panels), and gated (right panels) accumulator models to the pooled data set. Each panel shows the predicted cumulative response time (RT) distributions for the pooled data set (solid lines) with observed 10th, 30th, 50th, 70th, and 90th percentiles (open circles). Easy is red, hard is green.
Figure 9
Figure 9
Behavioral predictions of the perfect (left panels), leaky (middle panels), and gated (right panels) accumulator models to all data sets. Each panel shows a scatterplot of the observed versus predicted response time (RT) quantiles that were fit by the data. Easy is red, hard is green. Monkey F = ○, L = +, Mm = Δ, Mc = x, and Q = ●.
Figure 10
Figure 10
Movement neuron activity. A: Activity for a representative movement neuron from fast and slow trials (average activity from 10 consecutive trials at the 0.1 and 0.9 response time [RT] quantiles). B: Scatterplots of neural measurements plotted versus RT. Insets illustrate the pattern of activity implicated by a significant correlation. C: Mean correlation across all movement neurons. Percentages of neurons with significant correlation are shown below. D: Mean distractor/target (D/T) ratio. Error bars are 95% confidence intervals. Easy trials are in red, hard trials in green. Fast trials are in black, slow trials in grey. Inset illustrates calculation. sp/s = spikes per second.
Figure 11
Figure 11
Simulation results: perfect accumulator models. The left panels plot the sample trajectories for the race (Panel A), diffusion (Panel B), and competitive (Panel C) models. The left panels plot model activation from fast and slow trials (average activity from 10 consecutive trials at the 0.1 and 0.9 response time [RT] quantiles). The center panels plot the mean correlation for simulated data. The right panels plot the mean predicted distractor/target (D/T) ratio. Brackets are 95% confidence intervals around observed mean values. Symbols indicate Data Sets F (○), L (+), Mm (△), Mc (x), Q (●), and pooled (□). Easy trials are in red, hard trials in green.
Figure 12
Figure 12
Simulation results: leaky accumulator models. The left panels plot the sample trajectories for the race (Panel A), diffusion (Panel B), and competitive (Panel C) models. The left panels plot model activation from fast and slow trials (average activity from 10 consecutive trials at the 0.1 and 0.9 response time [RT] quantiles). The center panels plot the mean correlation for simulated data. The right panels plot the mean predicted distractor/target (D/T) ratio. Brackets are 95% confidence intervals around observed mean values. Symbols indicate Data Sets F (○), L (+), Mm (△), Mc (x), Q (●), and pooled (□). Easy trials are in red, hard trials in green.
Figure 13
Figure 13
Simulation results: gated accumulator models. The left panels plot the sample trajectories for the race (Panel A), diffusion (Panel B), and competitive (Panel C) models. The left panels plot model activation from fast and slow trials (average activity from 10 consecutive trials at the 0.1 and 0.9 response time [RT] quantiles). The center panels plot the mean correlation for simulated data. The right panels plot the mean predicted distractor/target (D/T) ratio. Brackets are 95% confidence intervals around observed mean values. Symbols indicate Data Sets F (○), L (+), Mm (△), Mc (x), Q (●), and pooled (□). Easy trials are in red, hard trials in green.
Figure 14
Figure 14
Mean onset, growth rate, baseline, and threshold. Observed data are shown with brackets indicating 95% confidence intervals around the mean. Predicted data are shown using symbols. Easy is red, hard is green. Monkey F = ○, L = +, Mm = △, Mc = x, and Q =●. sp/s = spikes per second.

References

    1. Ashby FG. A stochastic version of general recognition theory. Journal of Mathematical Psychology. 2000;44:310–329. - PubMed
    1. Barash S, Bracewell RM, Fogassi L, Gnadt JW, Andersen RA. Saccade-related activity in the lateral intraparietal area: I. Temporal properties; comparison with area 7a. Journal of Neurophysiology. 1991;66:1095–1108. - PubMed
    1. Basso MA, Wurtz RH. Modulation of neuronal activity by target uncertainty. Nature. 1997 September 4;389:66–69. - PubMed
    1. Beck JM, Ma WJ, Kiani R, Hanks T, Churchland AK, Roitman J, Pouget A. Probabilistic population codes for Bayesian decision making. Neuron. 2008;60:1142–1152. - PMC - PubMed
    1. Berman RA, Joiner WM, Cavanaugh J, Wurtz RH. Modulation of presaccadic activity in the frontal eye field by the superior colliculus. Journal of Neurophysiology. 2009;101:2934–2942. - PMC - PubMed

Publication types