. 2010 Sep 7:9:234.
doi: 10.1186/1476-4598-9-234.

An ANOCEF genomic and transcriptomic microarray study of the response to radiotherapy or to alkylating first-line chemotherapy in glioblastoma patients

Affiliations

An ANOCEF genomic and transcriptomic microarray study of the response to radiotherapy or to alkylating first-line chemotherapy in glioblastoma patients

François Ducray et al. Mol Cancer. .

Abstract

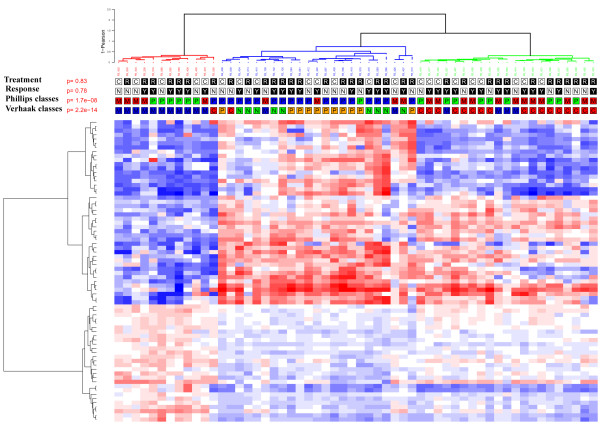
Background: The molecular characteristics associated with the response to treatment in glioblastomas (GBMs) remain largely unknown. We performed a retrospective study to assess the genomic characteristics associated with the response of GBMs to either first-line chemotherapy or radiation therapy. The gene expression (n = 56) and genomic profiles (n = 67) of responders and non-responders to first-line chemotherapy or radiation therapy alone were compared on Affymetrix Plus 2 gene expression arrays and BAC CGH arrays.

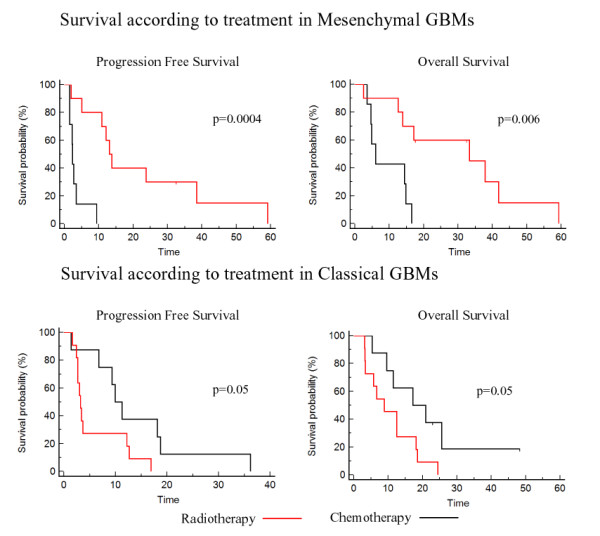
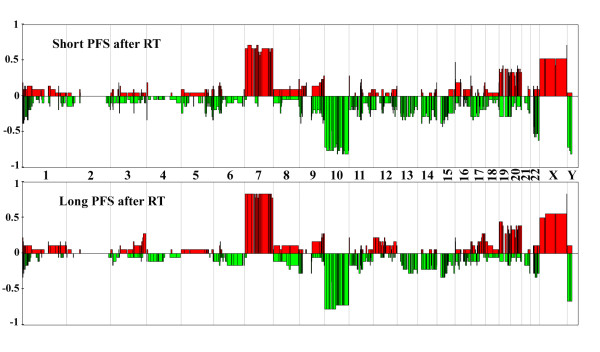
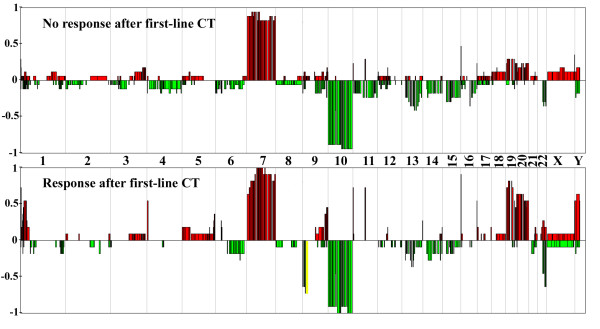
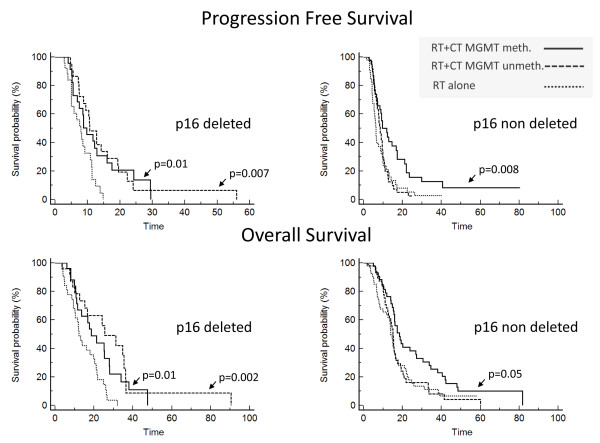
Results: According to Verhaak et al.'s classification system, mesenchymal GBMs were more likely to respond to radiotherapy than to first-line chemotherapy, whereas classical GBMs were more likely to respond to first-line chemotherapy than to radiotherapy. In patients treated with radiation therapy alone, the response was associated with differential expression of microenvironment-associated genes; the expression of hypoxia-related genes was associated with short-term progression-free survival (< 5 months), whereas the expression of immune genes was associated with prolonged progression-free survival (> 10 months). Consistently, infiltration of the tumor by both CD3 and CD68 cells was significantly more frequent in responders to radiotherapy than in non-responders. In patients treated with first-line chemotherapy, the expression of stem-cell genes was associated with resistance to chemotherapy, and there was a significant association between response to treatment and p16 locus deletions. Consistently, in an independent data set of patients treated with either radiotherapy alone or with both radiotherapy and adjuvant chemotherapy, we found that patients with the p16 deletion benefited from adjuvant chemotherapy regardless of their MGMT promoter methylation status, whereas in patients without the p16 deletion, this benefit was only observed in patients with a methylated MGMT promoter.

Conclusion: Differential expression of microenvironment genes and p16 locus deletion are associated with responses to radiation therapy and to first-line chemotherapy, respectively, in GBM. Recently identified transcriptomic subgroups of GBMs seem to respond differently to radiotherapy and to first-line chemotherapy.


Figures

Figure 1
Figure 1
Unsupervised clustering of the 56 glioblastomas. Unsupervised hierarchical clustering of the 56 GBMs. The heatmap was done with the 72 probe sets used in the centroid classifier that was able to generate the 3 groups identified through unsupervised clustering (Additional file 1 Table S2). Samples and genes were clustered using Ward's linkage and 1-Pearson correlation coefficient. For each probe set, the lowest and highest intensity values are displayed in blue and red, respectively. Treatment: C = First-line chemotherapy, R = Radiotherapy. Response: N = non-responder, Y = responder. Phillips = class according to Phillips et al.'s classification [8], blue P = Proneural, green P = Proliferative, M = Mesenchymal. Verhaak = class according to Verhaak et al.'s classification [10], N = Neural, C = Classical, M = Mesenchymal, P = Proneural. The GBMs were classified into three groups: one group enriched in EGFR-amplified patients (n = 19, blue cluster), one group characterized by a high level of expression of immune and extra-cellular matrix genes (n = 12, red cluster) and one group characterized by a higher of expression of neural genes (n = 25, green cluster). There was a significant overlap when using Phillips et al.'s classes (Fisher's exact test p-value = 1.7 × 10⁻⁸) and a larger overlap with Verhaak et al.'s classes (Fisher's exact test p-value = 2.2 × 10⁻¹⁴).
Figure 2
Figure 2
Survival according to treatment in mesenchymal and classical GBMs. Progression-free survival and overall survival according to treatment (radiotherapy = red, first-line chemotherapy = black) in the GBMs of the present study classified as mesenchymal or classical according to Verhaak et al.'s classes [10].
Figure 3
Figure 3
Genomic profiles of patients with short and long PFS after radiation therapy. CGH array genomic profiles of the patients with short (< 5 months) and long (> 10 months) PFS after radiotherapy. For each chromosome, the telomere of the short arm is on the left and the telomere of the long arm is on the right. Genomic gains and losses are shown in red and green, respectively. The y-axis corresponds to the frequency of gains and losses in each group of patients.
Figure 4
Figure 4
Genomic profiles of non-responders and responders to first-line chemotherapy. CGH array genomic profiles of the non-responders and the responders to first line chemotherapy. For each chromosome, the telomere of the short arm is on the left and the telomere of the long arm is on the right. Genomic gains and losses are shown in red and green, respectively. p16 locus homozygous deletion is shown in yellow. The y-axis corresponds to the frequency of gains and losses in each group of patients.
Figure 5
Figure 5
Survival according to treatment, radiotherapy alone or radiotherapy and adjuvant chemotherapy, p16 deletion and MGMTP methylation in an independent series of 222 GBMs. The y-axis corresponds to the survival probability and the x-axis to survival time (months). Survival curves on the left correspond to the patients with p16 deletions; survival curves on the right correspond to patients without p16 deletions. These survival curves show that patients with p16 deletions benefit from adjuvant chemotherapy regardless of their MGMTP methylation status, whereas patients without p16 deletions benefit from adjuvant chemotherapy only when they have a methylated MGMTP.

References

    1. McLendon R, Friedman A, Bigner D, Van Meir EG, Brat DJ, Marie Mastrogianakis G, Olson JJ, Mikkelsen T, Lehman N, Aldape K. et al.Comprehensive genomic characterization defines human glioblastoma genes and core pathways. Nature. 2008;23;455(7216):1061–8. doi: 10.1038/nature07385. Epub 2008 Sep 4. - DOI - PMC - PubMed
    1. Parsons DW, Jones S, Zhang X, Lin JC, Leary RJ, Angenendt P, Mankoo P, Carter H, Siu IM, Gallia GL. et al.An Integrated Genomic Analysis of Human Glioblastoma Multiforme. Science. 2008;321(5897):1807–1812. doi: 10.1126/science.1164382. - DOI - PMC - PubMed
    1. Ducray F, Idbaih A, de Reynies A, Bieche I, Thillet J, Mokhtari K, Lair S, Marie Y, Paris S, Vidaud M. et al.Anaplastic oligodendrogliomas with 1p19q codeletion have a proneural gene expression profile. Mol Cancer. 2008;7:41. doi: 10.1186/1476-4598-7-41. - DOI - PMC - PubMed
    1. Freije WA, Castro-Vargas FE, Fang Z, Horvath S, Cloughesy T, Liau LM, Mischel PS, Nelson SF. Gene expression profiling of gliomas strongly predicts survival. Cancer Res. 2004;64:6503–6510. doi: 10.1158/0008-5472.CAN-04-0452. - DOI - PubMed
    1. Idbaih A, Marie Y, Lucchesi C, Pierron G, Manie E, Raynal V, Mosseri V, Hoang-Xuan K, Kujas M, Brito I. et al.BAC array CGH distinguishes mutually exclusive alterations that define clinicogenetic subtypes of gliomas. Int J Cancer. 2008;122:1778–1786. doi: 10.1002/ijc.23270. - DOI - PubMed

Publication types

MeSH terms

Substances