

Comparison of unrestrained plethysmography and forced oscillation for identifying genetic variability of airway responsiveness in inbred mice
- PMID: 20823217
- PMCID: PMC3026348
- DOI: 10.1152/physiolgenomics.00108.2010
Comparison of unrestrained plethysmography and forced oscillation for identifying genetic variability of airway responsiveness in inbred mice
Abstract
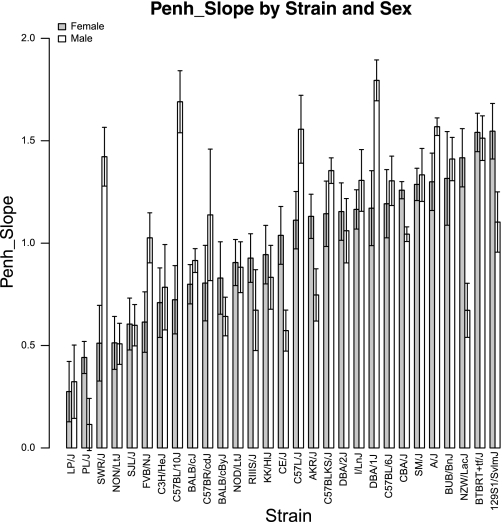
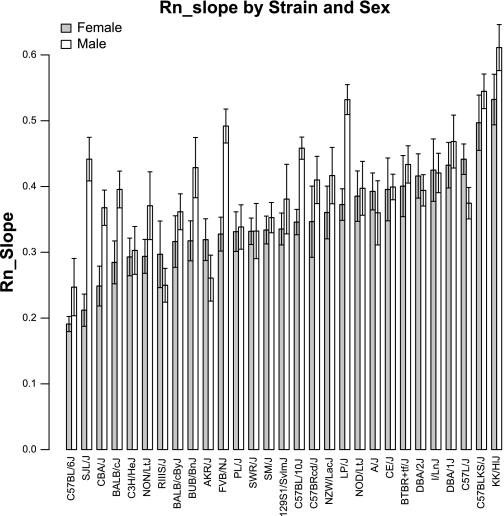
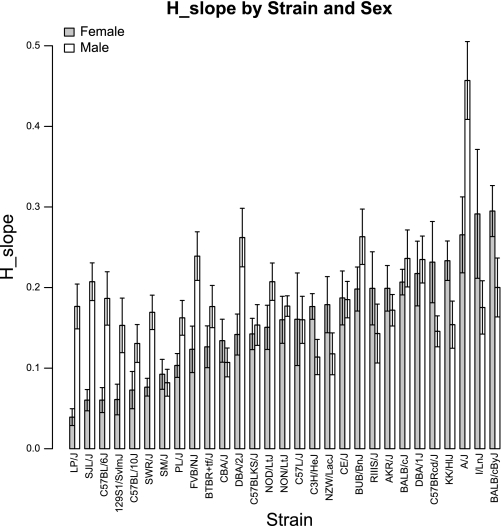
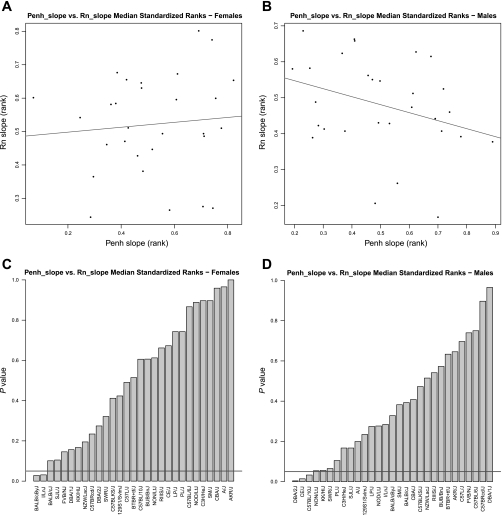
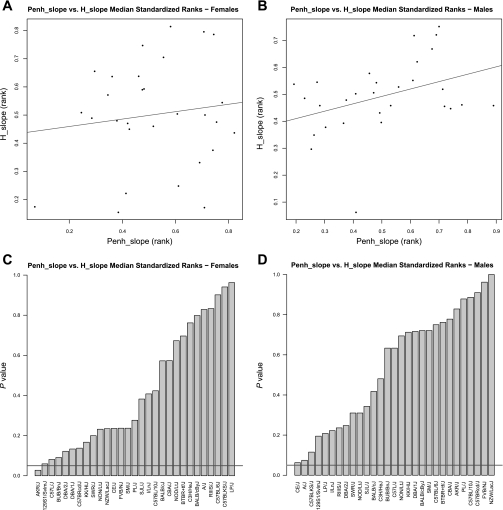
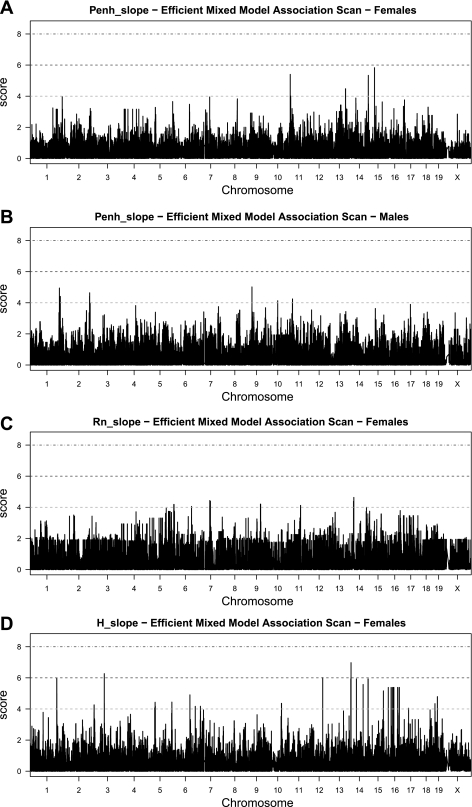
Lung function detection in mice is currently most accurately measured by invasive techniques, which are costly, labor intensive, and terminal. This limits their use for large-scale or longitudinal studies. Noninvasive assays are often used instead, but their accuracy for measuring lung function parameters such as resistance and elastance has been questioned in studies involving small numbers of mouse strains. Here we compared parameters detected by two different methods using 29 inbred mouse strains: enhanced pause (Penh), detected by unrestrained plethysmography, and central airway resistance and lung elastance, detected by a forced oscillation technique. We further tested whether the phenotypic variations were determined by the same genomic location in genome-wide association studies using a linear mixed model algorithm. Penh, resistance, and elastance were measured in nonexposed mice or mice exposed to saline and increasing doses of aerosolized methacholine. Because Penh differed from airway resistance in several strains and because the peak genetic associations found for Penh, resistance, or elastance were located at different genomic regions, we conclude that using Penh as an indicator for lung function changes in high-throughput genetic studies (i.e., genome-wide association studies or quantitative trait locus studies) measures something fundamentally different than airway resistance and lung elastance.
Figures
References
-
- Ackerman KG, Huang H, Grasemann H, Puma C, Singer JB, Hill AE, Lander E, Nadeau JH, Churchill GA, Drazen JM, Beier DR. Interacting genetic loci cause airway hyperresponsiveness. Physiol Genomics 21: 105–111, 2005 - PubMed
-
- Adler A, Cieslewicz G, Irvin CG. Unrestrained plethysmography is an unreliable measure of airway responsiveness in BALB/c and C57BL/6 mice. J Appl Physiol 97: 286–292, 2004 - PubMed
-
- Bates JH, Irvin CG. Measuring lung function in mice: the phenotyping uncertainty principle. J Appl Physiol 94: 1297–1306, 2003 - PubMed
-
- Bates JH, Thompson-Figueroa J, Lundblad LK, Irvin CG. Unrestrained video-assisted plethysmography: a noninvasive method for assessment of lung mechanical function in small animals. J Appl Physiol 104: 253–261, 2008 - PubMed
-
- Chang HY, Mitzner W. Sex differences in mouse models of asthma. Can J Physiol Pharmacol 85: 1226–1235, 2007 - PubMed
Publication types
MeSH terms
Substances
Grants and funding
LinkOut - more resources
Full Text Sources
Molecular Biology Databases