

Discovering graphical Granger causality using the truncating lasso penalty
- PMID: 20823316
- PMCID: PMC2935442
- DOI: 10.1093/bioinformatics/btq377
Discovering graphical Granger causality using the truncating lasso penalty
Abstract
Motivation: Components of biological systems interact with each other in order to carry out vital cell functions. Such information can be used to improve estimation and inference, and to obtain better insights into the underlying cellular mechanisms. Discovering regulatory interactions among genes is therefore an important problem in systems biology. Whole-genome expression data over time provides an opportunity to determine how the expression levels of genes are affected by changes in transcription levels of other genes, and can therefore be used to discover regulatory interactions among genes.
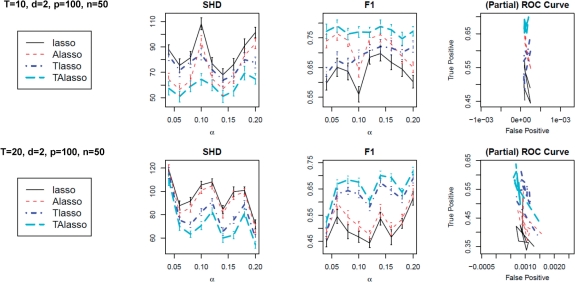
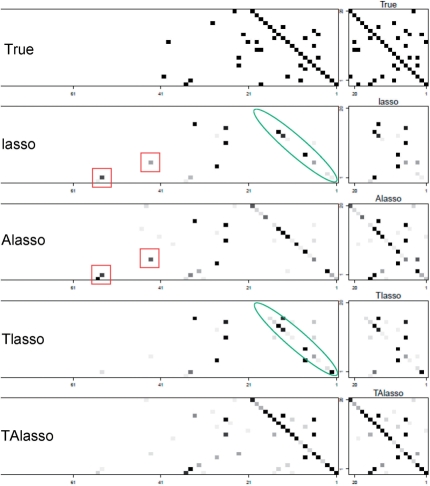
Results: In this article, we propose a novel penalization method, called truncating lasso, for estimation of causal relationships from time-course gene expression data. The proposed penalty can correctly determine the order of the underlying time series, and improves the performance of the lasso-type estimators. Moreover, the resulting estimate provides information on the time lag between activation of transcription factors and their effects on regulated genes. We provide an efficient algorithm for estimation of model parameters, and show that the proposed method can consistently discover causal relationships in the large p, small n setting. The performance of the proposed model is evaluated favorably in simulated, as well as real, data examples.
Availability: The proposed truncating lasso method is implemented in the R-package 'grangerTlasso' and is freely available at http://www.stat.lsa.umich.edu/~shojaie/.
Figures


References
-
- Arnold A, et al. Proceedings of the 13th ACM SIGKDD international conference on Knowledge discovery and data mining. New York, NY, USA: ACM; 2007. Temporal causal modeling with graphical granger methods; pp. 66–75.
-
- de Leeuw J. Block-relaxation algorithms in statistics. In: Bock HH, et al., editors. Information System and Data Analysis. 1994. pp. 308–325.
-
- Granger C. Investigating causal relations by econometric models and cross-spectral methods. Econometrica. 1969;37:424–438.
