. 2010 Dec;299(6):E887-98.
doi: 10.1152/ajpendo.00372.2010. Epub 2010 Sep 7.

Chronic consumption of a high-fat/high-fructose diet renders the liver incapable of net hepatic glucose uptake

Affiliations

Chronic consumption of a high-fat/high-fructose diet renders the liver incapable of net hepatic glucose uptake

Katie Colbert Coate et al. Am J Physiol Endocrinol Metab. 2010 Dec.

Abstract

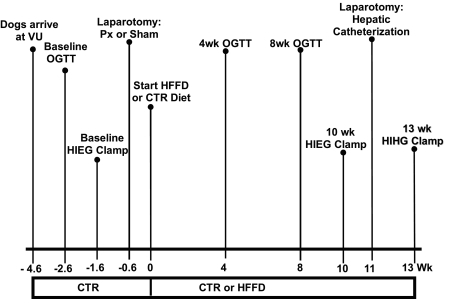
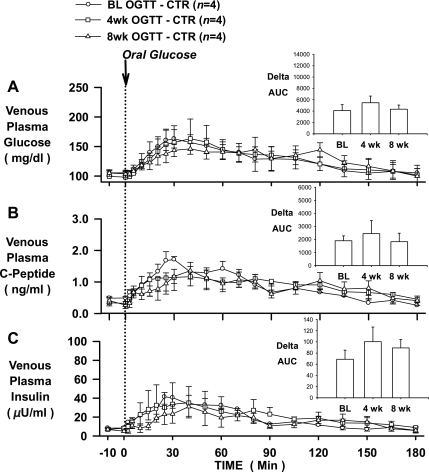
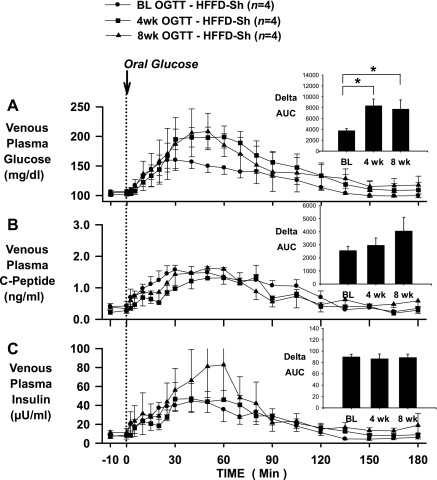
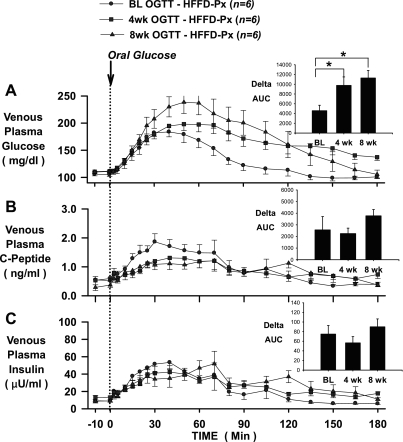
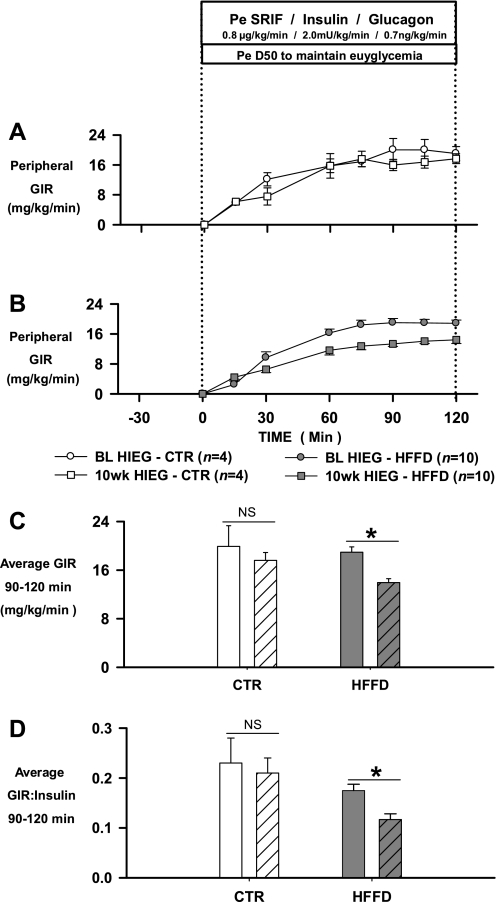
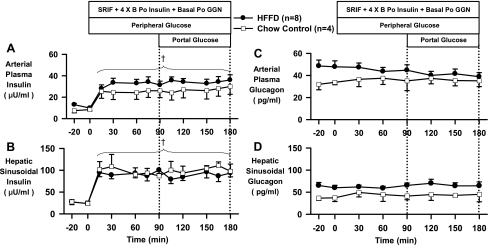
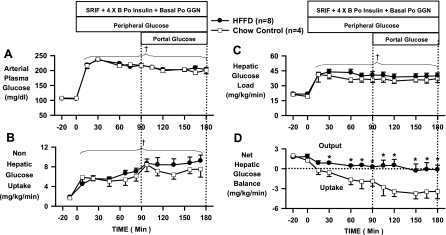
The objective of this study was to assess the response of a large animal model to high dietary fat and fructose (HFFD). Three different metabolic assessments were performed during 13 wk of feeding an HFFD (n = 10) or chow control (CTR, n = 4) diet: oral glucose tolerance tests (OGTTs; baseline, 4 and 8 wk), hyperinsulinemic-euglycemic clamps (HIEGs; baseline and 10 wk) and hyperinsulinemic-hyperglycemic clamps (HIHGs, 13 wk). The ΔAUC for glucose during the OGTTs more than doubled after 4 and 8 wk of HFFD feeding, and the average glucose infusion rate required to maintain euglycemia during the HIEG clamps decreased by ≈30% after 10 wk of HFFD feeding. These changes did not occur in the CTR group. The HIHG clamps included experimental periods 1 (P1, 0-90 min) and 2 (P2, 90-180 min). During P1, somatostatin, basal intraportal glucagon, 4 × basal intraportal insulin, and peripheral glucose (to double the hepatic glucose load) were infused; during P2, glucose was also infused intraportally (4.0 mg·kg(-1)·min(-1)). Net hepatic glucose uptake during P1 and P2 was -0.4 ± 0.1 [output] and 0.2 ± 0.8 mg·kg(-1)·min(-1) in the HFFD group, respectively, and 1.8 ± 0.8 and 3.5 ± 1.0 mg·kg(-1)·min(-1) in the CTR group, respectively (P < 0.05 vs. HFFD during P1 and P2). Glycogen synthesis through the direct pathway was 0.5 ± 0.2 and 1.5 ± 0.4 mg·kg(-1)·min(-1) in the HFFD and CTR groups, respectively (P < 0.05 vs. HFFD). In conclusion, chronic consumption of an HFFD diminished the sensitivity of the liver to hormonal and glycemic cues and resulted in a marked impairment in NHGU and glycogen synthesis.


Figures

Fig. 1.
Fig. 1.
Experimental timeline. Numbers below horizontal line indicate week in which an experiment or surgery was conducted relative to initiation of experimental diets (CTR or HFFD). CTR, standard meat and laboratory chow diet; HFFD, high-fat/high-fructose diet; VU, Vanderbilt University; OGTT, oral glucose tolerance test; HIEG, hyperinsulinemic euglycemic clamp; Px, partial pancreatectomy; HIHG, hyperinsulinemic hyperglycemic clamp.
Fig. 2.
Fig. 2.
OGTTs conducted in 24-h-fasted dogs at baseline (BL; circles), and after 4 (squares) and 8 (triangles) wk of feeding a CTR diet (n = 4). Polycose was administered orally (0.9 g/kg), and plasma glucose (A), C-peptide (B), and insulin (C) concentrations were measured over 180 min. Insets: AUCs over 180 min for glucose (A), C-peptide (B), and insulin (C). Data are means ± SE.
Fig. 3.
Fig. 3.
OGTTs conducted in 24-h-fasted dogs at baseline (BL; circles), and after 4 (squares) and 8 (triangles) wk of feeding a HFFD to sham-operated dogs (HFFD-Sh; n = 4). Polycose was administered orally (0.9 g/kg), and plasma glucose (A), C-peptide (B), and insulin (C) concentrations were measured over 180 min. Insets: AUCs over 180 min for glucose (A), C-peptide (B), and insulin (C). Data are means ± SE. *P < 0.05 vs. baseline ΔAUC.
Fig. 4.
Fig. 4.
OGTTs conducted in 24-h-fasted dogs at baseline (BL; circles), and after 4 (squares) and 8 (triangles) wk of feeding a HFFD to partially pancreatectomized dogs (HFFD-Px; n = 6). Polycose was administered orally (0.9 g/kg), and plasma glucose (A), C-peptide (B), and insulin (C) concentrations were measured over 180 min. Insets: AUCs over 180 min for glucose (A), C-peptide (B), and insulin (C). Data are means ± SE. *P < 0.05 vs. baseline ΔAUC.
Fig. 5.
Fig. 5.
Mean glucose infusion rates (GIR; A and B) during HIEG clamps conducted in 18-h-fasted dogs at baseline (BL; circles) and after 10 wk (squares) of feeding a CTR diet (n = 4; A) or a HFFD to Sh or Px (n = 10; B) dogs. Average GIR (C) and GIR-to-insulin ratios (D) during 90–120 min of HIEGs conducted at BL (filled bars) and after 10 wk (patterned bars) of feeding a CTR or HFFD diet. Data from HFFD-Sh and HFFD-Px groups were combined in B–D because the reduction in GIR (in mg·kg−1·min−1) after 10 wk of HFFD feeding was similar between groups (HFFD-Sh, BL: 18.5 ± 1.7, 10 wk: 13.9 ± 0.7; HFFD-Px, BL: 19.2 ± 1.3, 10 wk: 14.1 ± 1.1). Data are means ± SE. *P < 0.05 vs. baseline.
Fig. 6.
Fig. 6.
Arterial plasma insulin (A) and glucagon (C), and hepatic sinusoidal insulin (B) and glucagon (D) during basal (−20 to 0 min) and experimental periods (0 to 180 min) of HIHG clamps conducted in 18-h-fasted dogs after 13 wk of feeding CTR (n = 4; □) or HFFD (n = 8; ●) diet. Data from HFFD-Sh and HFFD-Px groups were combined in this figure because there were no differences between groups for these clamped parameters. Data are means ± SE. †P < 0.05 vs. basal period (HFFD and CTR groups); *P < 0.05 vs. CTR group.
Fig. 7.
Fig. 7.
Arterial blood glucose (A), nonhepatic glucose uptake (Non-HGU; B), hepatic glucose load (C), and net hepatic glucose balance (NHGB; D) during basal (−20 to 0 min) and experimental periods (0 to 180 min) of HIHG clamps conducted in 18-h-fasted dogs after 13 wk of feeding a CTR (n = 4; □) or HFFD (n = 8; ●) diet. Negative values for NHGB indicate net hepatic uptake; positive values indicate net hepatic production. Data from HFFD-Sh and HFFD-Px groups were combined for HIHG analyses because there was no difference in NHGB (mg·kg−1·min−1) between groups [average during last 30 min of 2 subperiods (P1, 0–90 min; P2, 90–180 min); HFFD-Sh: −0.1 ± 0.5; HFFD-Px: 0.3 ± 0.8]. Data are means ± SE. †P < 0.05 vs. basal period (HFFD and CTR groups); *P < 0.05 vs. CTR group.

Similar articles

Cited by

References

    1. Adkins-Marshall BA, Myers SR, Hendrick GK, Williams PE, Triebwasser K, Floyd B, Cherrington AD. Interaction between insulin and glucose-delivery route in regulation of net hepatic glucose uptake in conscious dogs. Diabetes 39: 87–95, 1990 - PubMed
    1. An Z, DiCostanzo CA, Moore MC, Edgerton DS, Dardevet DP, Neal DW, Cherrington AD. Effects of the nitric oxide donor SIN-1 on net hepatic glucose uptake in the conscious dog. Am J Physiol Endocrinol Metab 294: E300–E306, 2008 - PubMed
    1. Basu A, Basu R, Shah P, Vella A, Johnson CM, Nair KS, Jensen MD, Schwenk WF, Rizza RA. Effects of type 2 diabetes on the ability of insulin and glucose to regulate splanchnic and muscle glucose metabolism: evidence for a defect in hepatic glucokinase activity. Diabetes 49: 272–283, 2000 - PubMed
    1. Bonner-Weir S, Trent DF, Weir GC. Partial pancreatectomy in the rat and subsequent defect in glucose-induced insulin release. J Clin Invest 71: 1544–1553, 1983 - PMC - PubMed
    1. Catena C, Giacchetti G, Novello M, Colussi G, Cavarape A, Sechi LA. Cellular mechanisms of insulin resistance in rats with fructose-induced hypertension. Am J Hypertens 16: 973–978, 2003 - PubMed

Publication types

MeSH terms