

Mutation rate estimates for 110 Y-chromosome STRs combining population and father-son pair data
- PMID: 20823913
- PMCID: PMC3039515
- DOI: 10.1038/ejhg.2010.154
Mutation rate estimates for 110 Y-chromosome STRs combining population and father-son pair data
Abstract
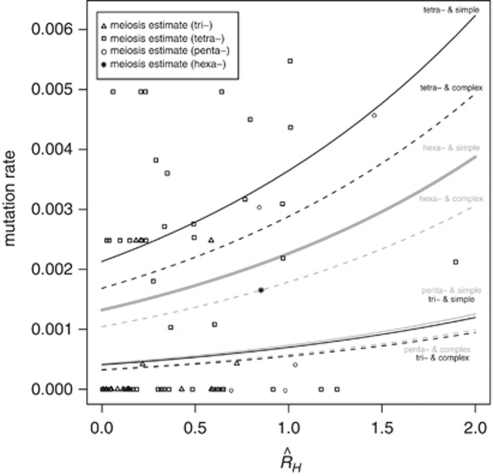
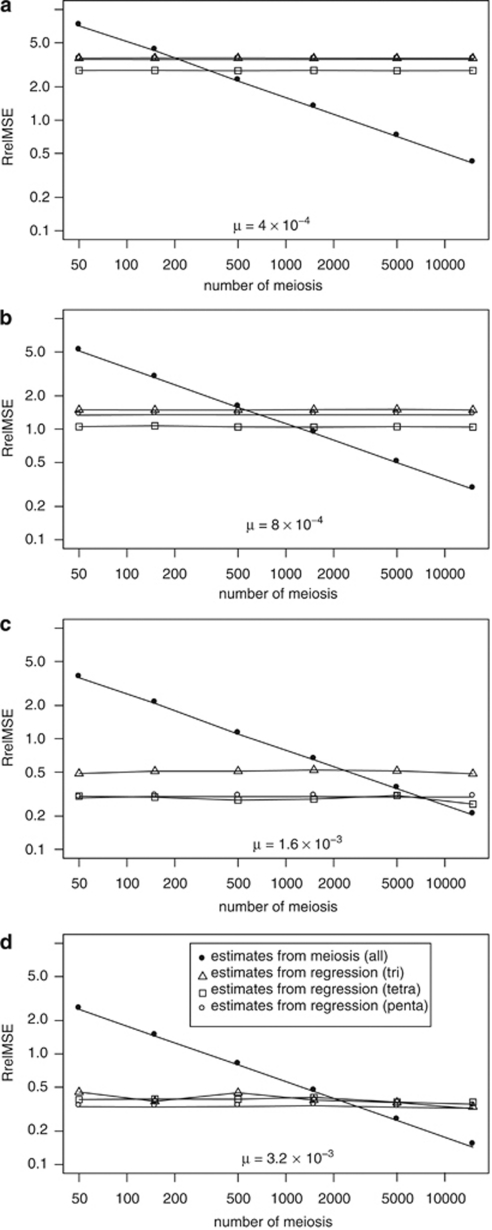
Y-chromosome microsatellites (Y-STRs) are typically used for kinship analysis and forensic identification, as well as for inferences on population history and evolution. All applications would greatly benefit from reliable locus-specific mutation rates, to improve forensic probability calculations and interpretations of diversity data. However, estimates of mutation rate from father-son transmissions are available for few loci and have large confidence intervals, because of the small number of meiosis usually observed. By contrast, population data exist for many more Y-STRs, holding unused information about their mutation rates. To incorporate single locus diversity information into Y-STR mutation rate estimation, we performed a meta-analysis using pedigree data for 80 loci and individual haplotypes for 110 loci, from 29 and 93 published studies, respectively. By means of logistic regression we found that relative genetic diversity, motif size and repeat structure explain the variance of observed rates of mutations from meiosis. This model allowed us to predict locus-specific mutation rates (mean predicted mutation rate 2.12 × 10(-3), SD=1.58 × 10(-3)), including estimates for 30 loci lacking meiosis observations and 41 with a previous estimate of zero. These estimates are more accurate than meiosis-based estimates when a small number of meiosis is available. We argue that our methodological approach, by taking into account locus diversity, could be also adapted to estimate population or lineage-specific mutation rates. Such adjusted estimates would represent valuable information for selecting the most reliable markers for a wide range of applications.
Figures
References
-
- Hanson EK, Ballantyne J. Comprehensive annotated STR physical map of the human Y chromosome: Forensic implications. Leg Med. 2006;8:110–120. - PubMed
-
- Kayser M, Sajantila A. Mutations at Y-STR loci: implications for paternity testing and forensic analysis. Forensic Sci Int. 2001;118:116–121. - PubMed
-
- Mulero JJ, Chang CW, Calandro LM, et al. Development and validation of the AmpFSTR® Yfiler™ PCR amplification kit: a male specific, single amplification 17 Y-STR multiplex system. J For Sci. 2006;51:64–75. - PubMed
