The potential for enhancing the power of genetic association studies in African Americans through the reuse of existing genotype data
- PMID: 20824062
- PMCID: PMC2932740
- DOI: 10.1371/journal.pgen.1001096
The potential for enhancing the power of genetic association studies in African Americans through the reuse of existing genotype data
Abstract
We consider the feasibility of reusing existing control data obtained in genetic association studies in order to reduce costs for new studies. We discuss controlling for the population differences between cases and controls that are implicit in studies utilizing external control data. We give theoretical calculations of the statistical power of a test due to Bourgain et al (Am J Human Genet 2003), applied to the problem of dealing with case-control differences in genetic ancestry related to population isolation or population admixture. Theoretical results show that there may exist bounds for the non-centrality parameter for a test of association that places limits on study power even if sample sizes can grow arbitrarily large. We apply this method to data from a multi-center, geographically-diverse, genome-wide association study of breast cancer in African-American women. Our analysis of these data shows that admixture proportions differ by center with the average fraction of European admixture ranging from approximately 20% for participants from study sites in the Eastern United States to 25% for participants from West Coast sites. However, these differences in average admixture fraction between sites are largely counterbalanced by considerable diversity in individual admixture proportion within each study site. Our results suggest that statistical correction for admixture differences is feasible for future studies of African-Americans, utilizing the existing controls from the African-American Breast Cancer study, even if case ascertainment for the future studies is not balanced over the same centers or regions that supplied the controls for the current study.
Conflict of interest statement
The authors have declared that no competing interests exist.
Figures

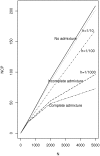
 namely
  = 0.2 (solid line) and
  = 0.25 (dotted lines).
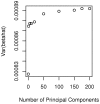
 as used in Figure 1.


 according to the number,
  , of eigenvectors adjusted for in the Bourgain test of association.
 .
.References
-
- Rothman KJ, Greenland S. Modern Epidemiology. Philadelphia: Lippincott-Raven; 1998.
-
- Rakovski CS, Stram DO. A kinship-based modification of the Armitage trend test to address hidden population structure and small differential genotyping errors. PLoS One. 2009;4:e5825. doi: 10.1371/journal.pone.0005825. - DOI - PMC - PubMed
-
- Astle W, Balding DJ. Population structure and cryptic relatedness in genetic association studies. Statistical Science. 2010 In press.
Publication types
MeSH terms
Grants and funding
- U01 CA069417/CA/NCI NIH HHS/United States
- R01-CA73629/CA/NCI NIH HHS/United States
- P30 ES010126/ES/NIEHS NIH HHS/United States
- P01 CA 017054-30/CA/NCI NIH HHS/United States
- R01-CA63464/CA/NCI NIH HHS/United States
- U01-CA69417/CA/NCI NIH HHS/United States
- R01 CA073629/CA/NCI NIH HHS/United States
- R01-CA100598/CA/NCI NIH HHS/United States
- R01 CA063464/CA/NCI NIH HHS/United States
- CA-06-503/CA/NCI NIH HHS/United States
- P01 CA017054/CA/NCI NIH HHS/United States
- R37 CA054281/CA/NCI NIH HHS/United States
- P50 CA058223/CA/NCI NIH HHS/United States
- P50-CA58223/CA/NCI NIH HHS/United States
- R01 CA100374/CA/NCI NIH HHS/United States
- R01-CA77305/CA/NCI NIH HHS/United States
- R01-CA100374/CA/NCI NIH HHS/United States
- R37-CA54281/CA/NCI NIH HHS/United States
- N01-HD-3-3175/HD/NICHD NIH HHS/United States
- P30-ES10126/ES/NIEHS NIH HHS/United States
- R01 CA100598/CA/NCI NIH HHS/United States
LinkOut - more resources
Full Text Sources
Molecular Biology Databases

