

Forcing versus feedback: epidemic malaria and monsoon rains in northwest India
- PMID: 20824122
- PMCID: PMC2932675
- DOI: 10.1371/journal.pcbi.1000898
Forcing versus feedback: epidemic malaria and monsoon rains in northwest India
Abstract
Malaria epidemics in regions with seasonal windows of transmission can vary greatly in size from year to year. A central question has been whether these interannual cycles are driven by climate, are instead generated by the intrinsic dynamics of the disease, or result from the resonance of these two mechanisms. This corresponds to the more general inverse problem of identifying the respective roles of external forcings vs. internal feedbacks from time series for nonlinear and noisy systems. We propose here a quantitative approach to formally compare rival hypotheses on climate vs. disease dynamics, or external forcings vs. internal feedbacks, that combines dynamical models with recently developed, computational inference methods. The interannual patterns of epidemic malaria are investigated here for desert regions of northwest India, with extensive epidemiological records for Plasmodium falciparum malaria for the past two decades. We formulate a dynamical model of malaria transmission that explicitly incorporates rainfall, and we rely on recent advances on parameter estimation for nonlinear and stochastic dynamical systems based on sequential Monte Carlo methods. Results show a significant effect of rainfall in the inter-annual variability of epidemic malaria that involves a threshold in the disease response. The model exhibits high prediction skill for yearly cases in the malaria transmission season following the monsoonal rains. Consideration of a more complex model with clinical immunity demonstrates the robustness of the findings and suggests a role of infected individuals that lack clinical symptoms as a reservoir for transmission. Our results indicate that the nonlinear dynamics of the disease itself play a role at the seasonal, but not the interannual, time scales. They illustrate the feasibility of forecasting malaria epidemics in desert and semi-arid regions of India based on climate variability. This approach should be applicable to malaria in other locations, to other infectious diseases, and to other nonlinear systems under forcing.
Conflict of interest statement
The authors have declared that no competing interests exist.
Figures
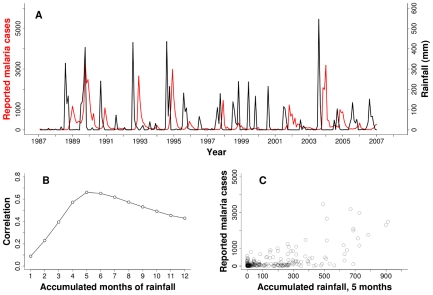
 malaria reported cases (red) and monthly rainfall from local stations (black) for Kutch. (B) Correlation between accumulated rainfall in different time windows preceding the month of reported cases. A maximum is observed when rainfall is accumulated over 5 to 6 months. (C) Monthly reported cases as a function of accumulated rainfall in the previous five months. A threshold, nonlinear response is apparent with no effect of rainfall below a value of around 200mm and an increase in both the mean and the variance of cases above it.
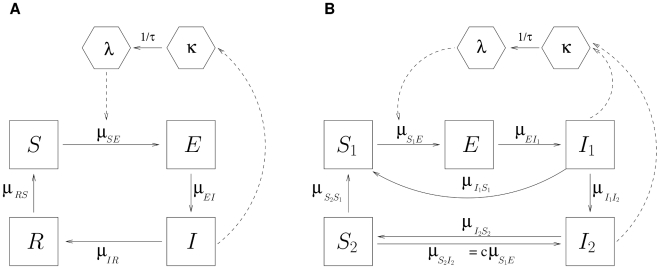
 model. Human classes in (A) are
  (Susceptible),
  (Exposed),
  (Infected), and
  (Recovered). Mosquito classes are κ (latent force of infection) and λ (current force of infection). The possibility of transition between classes
  and
and  is denoted by a solid arrow, with the corresponding rate written as
  . The average time of mosquitoes in the latent state is denoted by
  . The dotted arrows represent interactions between the human and mosquito stages of the parasite. The model in (B) adds clinical immunity , by differentiating between clinical infections that contribute to the measured cases, and less severe infections in a new class
  that are not clinical but remain infectious to mosquitoes at a lower level than
  . Clinical infections can fully recover becoming susceptible again, or remain parasitemic and transition to
  . Recovery from mild infections results in individuals who are fully protected from clinical disease, in class
  , whose further exposure to infected mosquitoes, can result again in mild infections. In time, clinical immunity can also be lost, with transitions from
  to
to  , and therefore the return to full susceptibility. Only a fraction
  of individuals in
  contribute to the force of infection; the susceptibility to infection is reduced by a factor
  in class
  relative to
  .
.
 ,
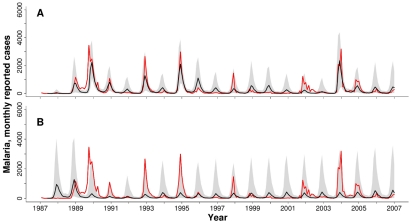
, ). Simulations of the model require the accumulated rainfall in the previous five months: to obtain this quantity, the observed rainfall is used only until the initial time (end of August or December) and the rest of the months are completed by replacing the ‘missing’ rainfall value (given that we are predicting one to four months ahead) by its monthly average. (A) VSEIRS model with rainfall; (B) VSEIRS model without rainfall.
References
-
- Cox J, Abeku TA. Early warning systems for malaria in Africa: from blueprint to practice. Trends Parasitol. 2008;23:243–246. - PubMed
-
- WHO-RBM. Malaria early warning systems-concepts, indicators and partners. 2001. A framework for field research in Africa (who/cds/rbm/2001.32). World Health Organization-Roll Back Malaria. URL http://www.who.int/malaria/cmc_upload/0/000/014/807/mews2.pdf.
-
- Thomson MC, Connor SJ. The development of malaria early warning systems for Africa. Trends Parasitol. 2001;17:438–445. - PubMed
-
- Earn DJD, Rohani P, Bolker BM, Grenfell BT. A simple model for complex dynamical transitions in epidemics. Science. 2000;287:667–670. - PubMed
-
- Rohani P, Keeling MJ, Grenfell BT. The interplay between determinism and stochasticity in childhood diseases. Am Nat. 2002;159:469–481. - PubMed
Publication types
MeSH terms
LinkOut - more resources
Full Text Sources
Miscellaneous
