

Allelic selection of amplicons in glioblastoma revealed by combining somatic and germline analysis
- PMID: 20824129
- PMCID: PMC2932683
- DOI: 10.1371/journal.pgen.1001086
Allelic selection of amplicons in glioblastoma revealed by combining somatic and germline analysis
Abstract
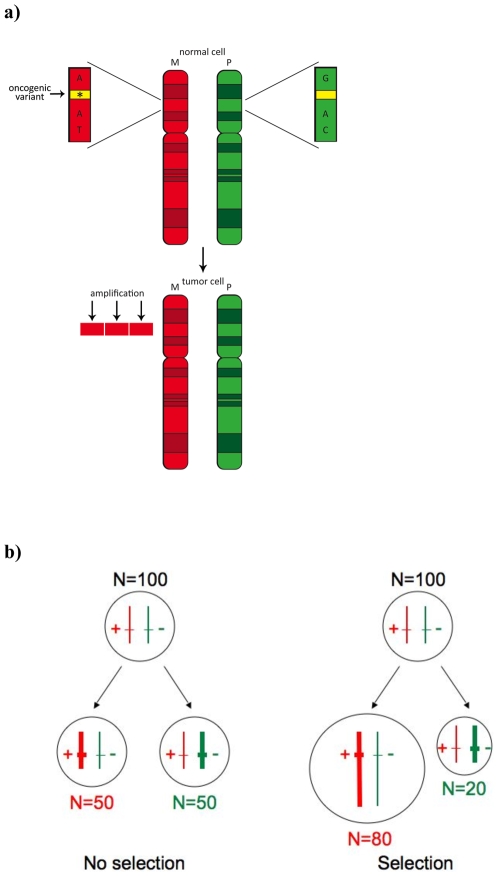
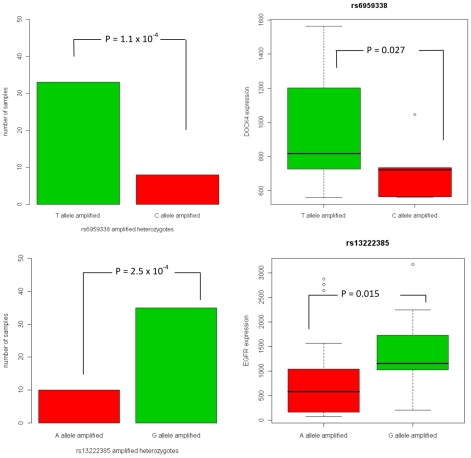
Cancer is a disease driven by a combination of inherited risk alleles coupled with the acquisition of somatic mutations, including amplification and deletion of genomic DNA. Potential relationships between the inherited and somatic aspects of the disease have only rarely been examined on a genome-wide level. Applying a novel integrative analysis of SNP and copy number measurements, we queried the tumor and normal-tissue genomes of 178 glioblastoma patients from the Cancer Genome Atlas project for preferentially amplified alleles, under the hypothesis that oncogenic germline variants will be selectively amplified in the tumor environment. Selected alleles are revealed by allelic imbalance in amplification across samples. This general approach is based on genetic principles and provides a method for identifying important tumor-related alleles. We find that SNP alleles that are most significantly overrepresented in amplicons tend to occur in genes involved with regulation of kinase and transferase activity, and many of these genes are known contributors to gliomagenesis. The analysis also implicates variants in synapse genes. By incorporating gene expression data, we demonstrate synergy between preferential allelic amplification and expression in DOCK4 and EGFR. Our results support the notion that combining germline and tumor genetic data can identify regions relevant to cancer biology.
Conflict of interest statement
The authors have declared that no competing interests exist.
Figures
References
-
- Nowell PC. The clonal evolution of tumor cell populations. Science. 1976;194:23–28. - PubMed
-
- de Koning JP, Wakabayashi Y, Nagase H, Mao JH, Balmain A. Convergence of congenic mapping and allele-specific alterations in tumors for the resolution of the Skts1 skin tumor susceptibility locus. Oncogene. 2007;26:4171–4178. - PubMed
-
- Nagase H, Mao JH, Balmain A. Allele-specific Hras mutations and genetic alterations at tumor susceptibility loci in skin carcinomas from interspecific hybrid mice. Cancer Res. 2003;63:4849–4853. - PubMed
-
- Ewart-Toland A, Briassouli P, de Koning JP, Mao JH, Yuan J, et al. Identification of Stk6/STK15 as a candidate low-penetrance tumor-susceptibility gene in mouse and human. Nat Genet. 2003;34:403–412. - PubMed
-
- Hienonen T, Salovaara R, Mecklin JP, Jarvinen H, Karhu A, et al. Preferential amplification of AURKA 91A (Ile31) in familial colorectal cancers. Int J Cancer. 2006;118:505–508. - PubMed
Publication types
MeSH terms
Substances
Grants and funding
LinkOut - more resources
Full Text Sources
Research Materials
Miscellaneous
