. 2010 Sep 1;5(9):e12501.
doi: 10.1371/journal.pone.0012501.

The effects of aging on the molecular and cellular composition of the prostate microenvironment

Affiliations

The effects of aging on the molecular and cellular composition of the prostate microenvironment

Daniella Bianchi-Frias et al. PLoS One. .

Abstract

Background: Advancing age is associated with substantial increases in the incidence rates of common diseases affecting the prostate gland including benign prostatic hyperplasia (BPH) and prostate carcinoma. The prostate is comprised of a functional secretory epithelium, a basal epithelium, and a supporting stroma comprised of structural elements, and a spectrum of cell types that includes smooth muscle cells, fibroblasts, and inflammatory cells. As reciprocal interactions between epithelium and stromal constituents are essential for normal organogenesis and serve to maintain normal functions, discordance within the stroma could permit or promote disease processes. In this study we sought to identify aging-associated alterations in the mouse prostate microenvironment that could influence pathology.

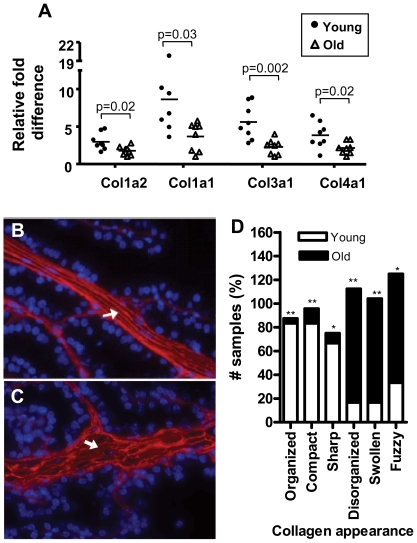
Methodology/principal findings: We quantitated transcript levels in microdissected glandular-adjacent stroma from young (age 4 months) and old (age 20-24 months) C57BL/6 mice, and identified a significant change in the expression of 1259 genes (p<0.05). These included increases in transcripts encoding proteins associated with inflammation (e.g., Ccl8, Ccl12), genotoxic/oxidative stress (e.g., Apod, Serpinb5) and other paracrine-acting effects (e.g., Cyr61). The expression of several collagen genes (e.g., Col1a1 and Col3a1) exhibited age-associated declines. By histology, immunofluorescence, and electron microscopy we determined that the collagen matrix is abundant and disorganized, smooth muscle cell orientation is disordered, and inflammatory infiltrates are significantly increased, and are comprised of macrophages, T cells and, to a lesser extent, B cells.

Conclusion/significance: These findings demonstrate that during normal aging the prostate stroma exhibits phenotypic and molecular characteristics plausibly contributing to the striking age associated pathologies affecting the prostate.


Conflict of interest statement

Competing Interests: The authors have declared that no competing interests exist.

Figures

Figure 1
Figure 1. Histological features of prostate glands from young and old mice.
Hematoxylin and eosin-stained sections of formalin-fixed prostate tissues from young (4 month-old) and old (24 month-old) mice. E: Luminal epithelium; S: Stroma adjacent to the epithelial cells (glandular-adjacent stroma). Note the thick glandular-adjacent cellular stroma (S, bracket) observed in dorsal and anterior lobe from young and old mice. AP insert: smooth-muscle cells (circled in white) appear less elongated and more rounded in the aged prostate with little evidence of cell orientation. Areas of inflammatory cell infiltration were observed frequently in the prostates of old animals (arrows). AP: anterior prostate; DP: dorsal prostate; LP: lateral prostate and VP: ventral prostate. (Magnification: 20×)
Figure 2
Figure 2. Age and cell type-specific transcript profiles in the mouse prostate.
A) Principal Component Analysis (PCA) for microdissected dorsal prostate stroma and epithelium from young and old animals. PCA discriminates epithelial and stromal samples. EO: old epithelium; EY: young epithelium; SO: old stroma; SY: young stroma. B) Transcript abundance levels (Log2 Ratios) obtained from microarray-based measurements for genes known to exhibit preferentially expression in stromal or epithelial cells. Red indicates increased expression; green indicates decreased expression. C) Heat map of age-associated transcripts in the prostate stroma (p<0.05) compared to epithelium. Insert: Gene symbols for the 10 most up- and down- regulated genes in the aged stroma. D) Heat map of age-associated transcripts in the prostate epithelium (p<0.05) compared to stroma. Insert: Gene symbols for the 10 most up- and down- regulated genes in the aged epithelium. Note the low correlation between the age-related profile of the stroma compared to the epithelium. Heat map colors reflect fold ratio values between sample and reference pool and mean-centered across samples. Columns represent biological replicates from microdissected dorsal and anterior epithelium and stroma for each age group. Rows represent individual genes. Values shown in red are relatively higher than the overall mean; values shown in green are relatively lower than the overall mean; rows shown in brown are genes with no expression values. STR: microdissected glandular-adjacent stroma; EPI: microdissected luminal epithelium.
Figure 3
Figure 3. Expression of Ccl8 and Apod with aging, senescence and cell type.
(A,B) Confirmation of stromal age-related changes in gene expression by qRT-PCR. RNAs were reverse transcribed and amplified using qRT-PCR with primers specific for Ccl8 and Apod. RNAs analyzed: microdissected glandular-adjacent stroma (STR) and epithelium (EPI) from dorsal (n = 4) and anterior (n = 4) prostate lobes from C57BL/6 young (n = 12) and old (n = 12) mice used in microarray analyses. White blood cells (WBC) were isolated from young and old C57BL/6 mice (n = 6). Note the higher expression of Ccl8 and Apod in the microdissected old stroma (Old STR) compared to young stroma (young STR). Also notice the low abundance in transcript levels of these two genes in microdissected young and old epithelium (Young EPI, Old EPI, respectively) and in white-blood cells (WBC). (C) Human pre-senescent and senescent prostate PSC27 fibroblasts. Pre-SEN: pre-senescent cells; SEN (ASH) cells induced to senesce by H2O2 exposure; SEN (Bleo) cells induced to senesce by bleomycin exposure; SEN (Rad) cells induced to senesce by radiation exposure; RPL13 transcript expression levels were used to normalize the human qRT-PCR data.
Figure 4
Figure 4. Age and inflammatory cell associated gene expression changes in the mouse prostate stroma.
A) Intrinsic smooth-muscle/fibroblastic stroma transcriptional profile. Genes whose signal intensity in the white blood cells (WBC) was higher than 800 intensity units were removed and listed in panel B. Note the high expression of genes in the old stroma (oSTR) compared to young stroma (ySTR) and white blood cells (WBC). B) Genes significantly up-regulated in the aged stroma that were also expressed in white-blood cells with signal intensity levels higher than 800 intensity units (in WBC). Heat map colors reflect fold ratio values between sample and reference pool and mean-centered across samples. Columns represent biological replicates from dorsal and anterior microdissected cells for each age group and white-blood cells. Rows represent individual genes. Values shown in red are relatively larger than the overall mean; values shown in green are relatively smaller than the overall mean. Gene lists represent the most significant up-regulated transcripts in old stroma compared to young stroma by unpaired, two-sample t-test analysis (p<0.05) with fold changes higher than 2.2. APS = anterior prostate stroma; DPS = dorsal prostate stroma; WBC = white blood cells.
Figure 5
Figure 5. Age-related alterations in collagen expression and structure.
A) Analysis of Col1a2, Col1a1, Col3a1 and Col4a1 transcripts by qRT-PCR from microdissected young (n = 8; 4-month-old) and old (n = 8; 24-month-old) anterior prostate stroma. Circle: young; Triangle: old. Ribosomal S16 transcript expression levels were used to normalize qRT-PCR data. Normalized results are expressed relative to the lowest expression value for each gene tested. B–D) Qualitative and quantitative confocal microscopy analysis for the appearance of collagen fibers in young and old mouse prostate. Thirty micrometer sections of anterior prostate lobes were stained by immunofluorescence with Collagen Type I antibody and were evaluated by confocal microscopy. Six scoring criteria were used to quantify the differences in collagen fiber appearance (organized, compact, sharp, disorganized, swollen and fuzzy collagen fibers). Five young and five old anterior prostates from independent mice were used and 4 images were taken from each sample **p<0.001 and *p<0.005. B, C) Representative images of Collagen Type I immunofluorescent stain of frozen sections from 4- (B) and 24-month (C) old mice (Magnification: 40×). Note the coarse and fragmented appearance and less regular distribution of collagen fibers in old prostates compared to the fine collagen fibers and highly organized network in the young prostate (arrows).
Figure 6
Figure 6. Ultrastructure of the young and aged mouse prostate.
A and B) Scanning electron microscopy of acellular preparations from young (A) and old (B) anterior prostate. General view of the anterior prostate from young (A) and old (B) mice. Ai–Bii) Representative images of high power fields from young (Ai and Aii) and old (Bi and Bii) anterior prostate. Note the collagen meshwork of loosely woven fibrils with an intact structure of distinct collagen bundles in the young prostate (Ai and Aii) compared to the adhered collagen bundles (brackets) and fragmentation of collagen fibrils (arrows) in aged prostate (Bi and Bii). This phenotype was observed in all analyzed samples and in different selected random field (young n = 5 and old n = 5). C and D) Transmission electron microscopy of cross sections from young (C, Ci) and old (D, Di) normal mouse prostate. C and D) general view of the glandular-adjacent stroma in proximity to the prostatic epithelium (E). Red dashed square: region presented in Ci and Di. Ci and Di) Detail of the epithelial-stromal interface in young (Ci) and old (Di) prostates with a thick basement membrane (bm). A thick layer of collagen fibrils (“co” and brackets) are distributed at the epithelium base and interspersed with smooth muscle cells (SMC). Yellow square: detail of an epithelial cell (E) with cytoplasmic expansions compressing the basement membrane. E indicates luminal epithelial; SMC, smooth muscle cells; bm and arrow, basement membrane; co: and brackets: collagen fibrils. These sections are representative of sections obtained from 4 prostates for each age group.
Figure 7
Figure 7. Prevalence of inflammatory cells in prostates from aged mice.
A–F) Immunohistochemical analysis of 4 µM paraffin sections from anterior prostate of young (A–C) and old (D–F) mice. Sections were stained with anti-F4/80 (A and D) anti-CD3 (B and E) and anti-B220 (C and F), which recognize macrophages, T cell and B cells, respectively. IHC demonstrated a high number of inflammatory cells within the aged prostate tissue. G) The number of cells positive for each immune-cell marker were determine by the number of cells/10X field on each lobe by blinded section analysis from young (4 month-old; n = 10) and old (24 month-old; n = 13) prostate sections. Inflammatory infiltrates were divided into three different categories: intraglandular infiltrates (inflammatory cells in contact with the glandular luminal epithelium); periglandular stromal infiltrates (inflammatory cells in contact with the smooth-muscle/fibroblastic cellular stroma); and interglandular infiltrates (inflammatory cells in the interglandular space). Data are mean ± standard error for all lobes combined. ***p<0.001; **p<0.005 and *p<0.05.

Similar articles

Cited by

References

    1. Davidovic M. Genetic stability: the key to longevity? Med Hypotheses. 1999;53:329–332. - PubMed
    1. Risques RA, Lai LA, Brentnall TA, Li L, Feng Z, et al. Ulcerative colitis is a disease of accelerated colon aging: evidence from telomere attrition and DNA damage. Gastroenterology. 2008;135:410–418. - PMC - PubMed
    1. Fraga MF, Ballestar E, Paz MF, Ropero S, Setien F, et al. From The Cover: Epigenetic differences arise during the lifetime of monozygotic twins. Proc Natl Acad Sci U S A. 2005;102:10604–10609. Epub 12005 Jul 10611. - PMC - PubMed
    1. Baylin SB, Herman JG, Graff JR, Vertino PM, Issa JP. Alterations in DNA methylation: a fundamental aspect of neoplasia. Adv Cancer Res. 1998;72:141–196. - PubMed
    1. Hanahan D, Weinberg RA. The hallmarks of cancer. Cell. 2000;100:57–70. - PubMed

Publication types