

Physical activity attenuates the genetic predisposition to obesity in 20,000 men and women from EPIC-Norfolk prospective population study
- PMID: 20824172
- PMCID: PMC2930873
- DOI: 10.1371/journal.pmed.1000332
Physical activity attenuates the genetic predisposition to obesity in 20,000 men and women from EPIC-Norfolk prospective population study
Abstract
Background: We have previously shown that multiple genetic loci identified by genome-wide association studies (GWAS) increase the susceptibility to obesity in a cumulative manner. It is, however, not known whether and to what extent this genetic susceptibility may be attenuated by a physically active lifestyle. We aimed to assess the influence of a physically active lifestyle on the genetic predisposition to obesity in a large population-based study.
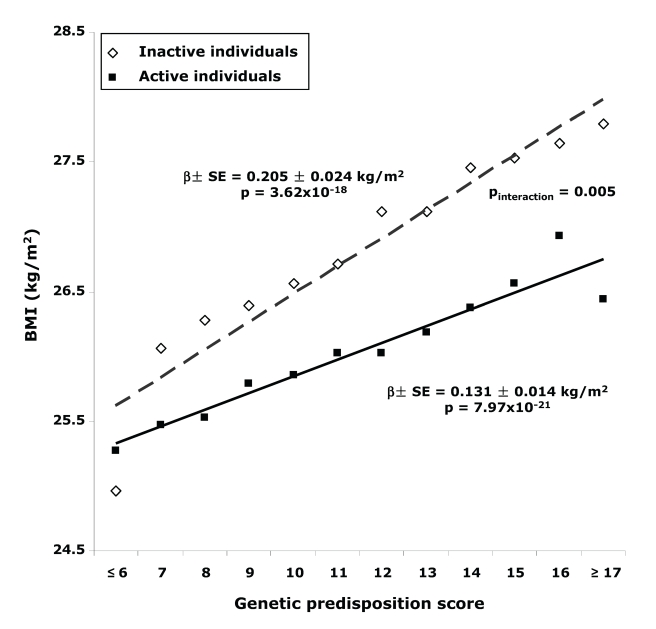
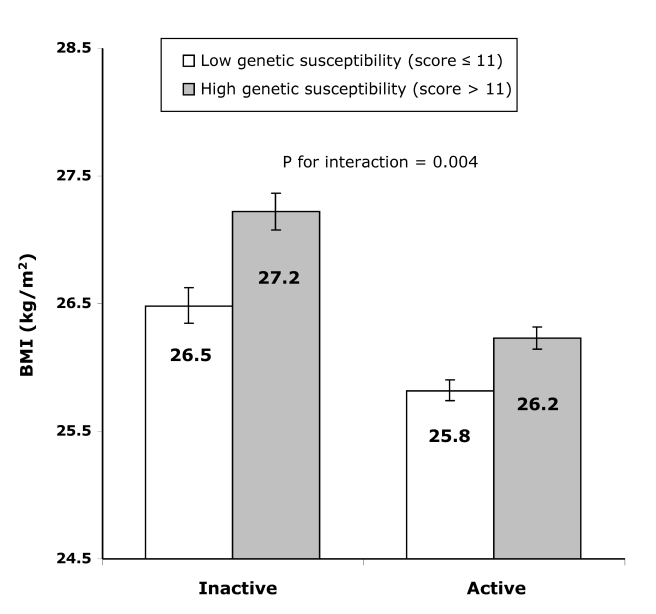
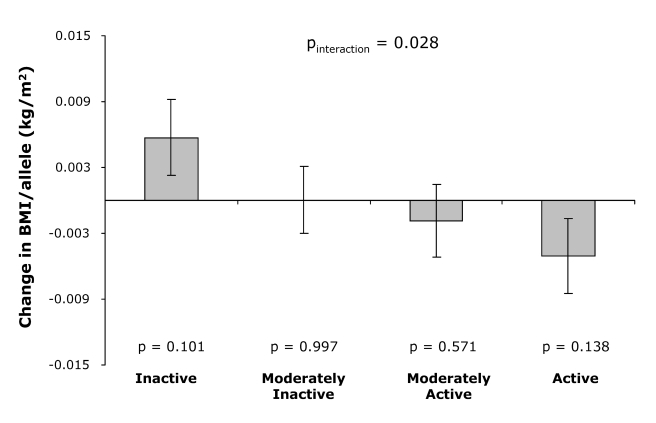
Methods and findings: We genotyped 12 SNPs in obesity-susceptibility loci in a population-based sample of 20,430 individuals (aged 39-79 y) from the European Prospective Investigation of Cancer (EPIC)-Norfolk cohort with an average follow-up period of 3.6 y. A genetic predisposition score was calculated for each individual by adding the body mass index (BMI)-increasing alleles across the 12 SNPs. Physical activity was assessed using a self-administered questionnaire. Linear and logistic regression models were used to examine main effects of the genetic predisposition score and its interaction with physical activity on BMI/obesity risk and BMI change over time, assuming an additive effect for each additional BMI-increasing allele carried. Each additional BMI-increasing allele was associated with 0.154 (standard error [SE] 0.012) kg/m(2) (p = 6.73 x 10(-37)) increase in BMI (equivalent to 445 g in body weight for a person 1.70 m tall). This association was significantly (p(interaction) = 0.005) more pronounced in inactive people (0.205 [SE 0.024] kg/m(2) [p = 3.62 x 10(-18); 592 g in weight]) than in active people (0.131 [SE 0.014] kg/m(2) [p = 7.97 x 10(-21); 379 g in weight]). Similarly, each additional BMI-increasing allele increased the risk of obesity 1.116-fold (95% confidence interval [CI] 1.093-1.139, p = 3.37 x 10(-26)) in the whole population, but significantly (p(interaction) = 0.015) more in inactive individuals (odds ratio [OR] = 1.158 [95% CI 1.118-1.199; p = 1.93 x 10(-16)]) than in active individuals (OR = 1.095 (95% CI 1.068-1.123; p = 1.15 x 10(-12)]). Consistent with the cross-sectional observations, physical activity modified the association between the genetic predisposition score and change in BMI during follow-up (p(interaction) = 0.028).
Conclusions: Our study shows that living a physically active lifestyle is associated with a 40% reduction in the genetic predisposition to common obesity, as estimated by the number of risk alleles carried for any of the 12 recently GWAS-identified loci. Please see later in the article for the Editors' Summary.
Conflict of interest statement
The authors have declared that no competing interests exist.
Figures
References
-
- Papas MA, Alberg AJ, Ewing R, Helzlsouer KJ, Gary TL, et al. The built environment and obesity. Epidemiol Rev. 2007;29:129–143. - PubMed
-
- Bouchard C. Gene-environment interactions in the etiology of obesity: defining the fundamentals. Obesity (Silver Spring) 2008;16(Suppl 3):S5–S10. - PubMed
-
- Hill JO. Understanding and addressing the epidemic of obesity: an energy balance perspective. Endocr Rev. 2006;27:750–761. - PubMed
-
- Ekelund U, Franks PW, Sharp S, Brage S, Wareham NJ. Increase in physical activity energy expenditure is associated with reduced metabolic risk independent of change in fatness and fitness. Diabetes Care. 2007;30:2101–2106. - PubMed
-
- Maes HH, Neale MC, Eaves LJ. Genetic and environmental factors in relative body weight and human adiposity. Behav Genet. 1997;27:325–351. - PubMed
Publication types
MeSH terms
Grants and funding
LinkOut - more resources
Full Text Sources
Medical
