. 2010 Aug 31;5(8):e12266.
doi: 10.1371/journal.pone.0012266.

Transcriptional reprogramming in nonhuman primate (rhesus macaque) tuberculosis granulomas

Affiliations

Transcriptional reprogramming in nonhuman primate (rhesus macaque) tuberculosis granulomas

Smriti Mehra et al. PLoS One. .

Abstract

Background: In response to Mtb infection, the host remodels the infection foci into a dense mass of cells known as the granuloma. The key objective of the granuloma is to contain the spread of Mtb into uninfected regions of the lung. However, it appears that Mtb has evolved mechanisms to resist killing in the granuloma. Profiling granuloma transcriptome will identify key immune signaling pathways active during TB infection. Such studies are not possible in human granulomas, due to various confounding factors. Nonhuman Primates (NHPs) infected with Mtb accurately reflect human TB in clinical and pathological contexts.

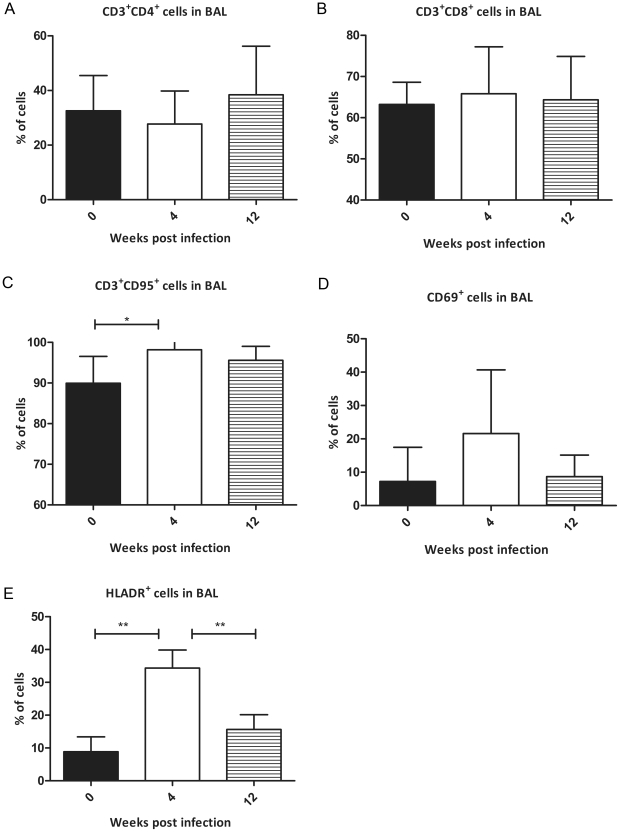
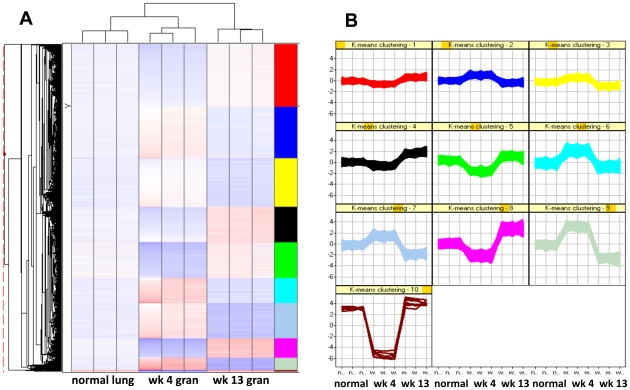
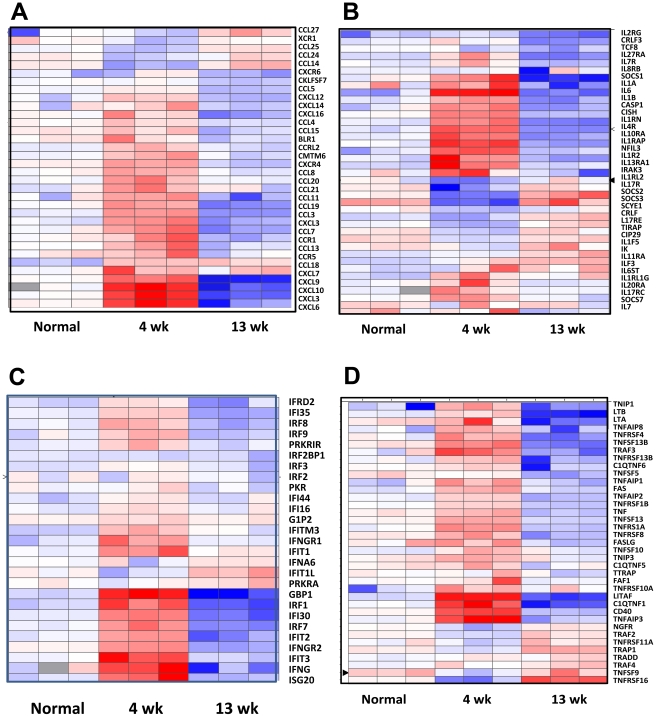
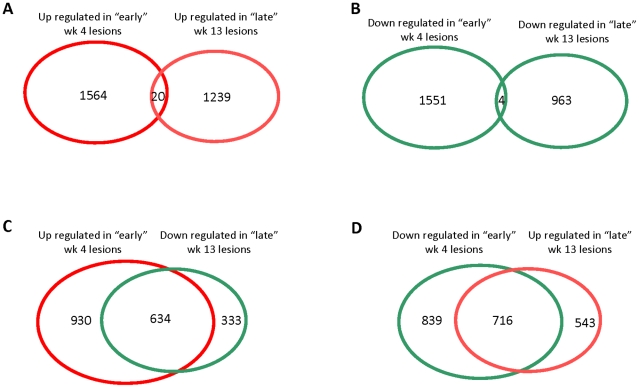
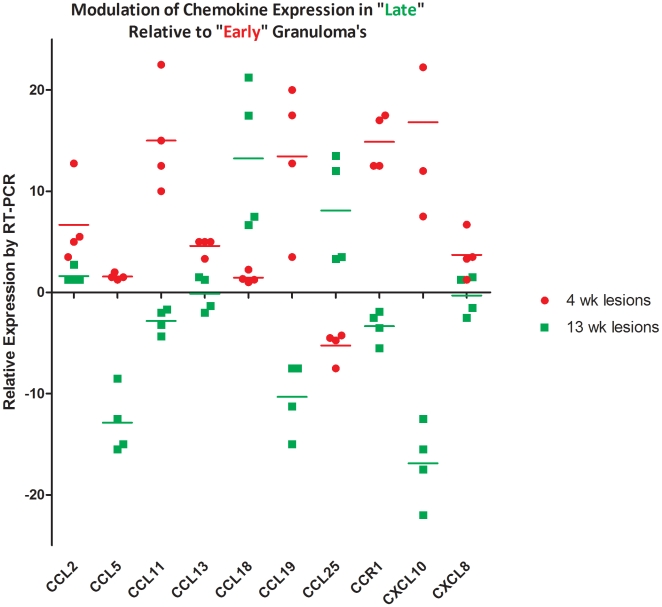
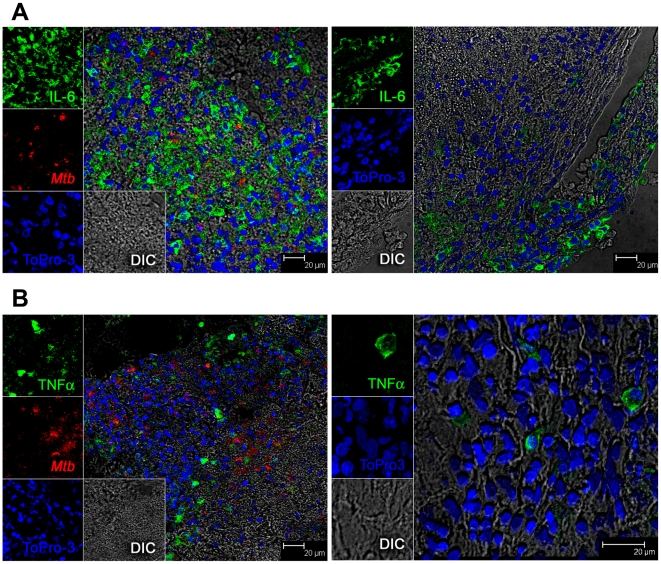
Methodology/principal findings: We studied transcriptomics of granuloma lesions in the lungs of NHPs exhibiting active TB, during early and late stages of infection. Early TB lesions were characterized by a highly pro-inflammatory environment, expressing high levels of immune signaling pathways involving IFNgamma, TNFalpha, JAK, STAT and C-C/C-X-C chemokines. Late TB lesions, while morphologically similar to the early ones, exhibited an overwhelming silencing of the inflammatory response. Reprogramming of the granuloma transcriptome was highly significant. The expression of approximately two-thirds of all genes induced in early lesions was later repressed.

Conclusions/significance: The transcriptional characteristics of TB granulomas undergo drastic changes during the course of infection. The overwhelming reprogramming of the initial pro-inflammatory surge in late lesions may be a host strategy to limit immunopathology. We propose that these host profiles can predict changes in bacterial replication and physiology, perhaps serving as markers for latency and reactivation.


Conflict of interest statement

Competing Interests: The authors have declared that no competing interests exist.

Figures

Figure 1
Figure 1. Comparison of lymphocyte recruitment and activation in “early” and “late” TB granulomas.
Flow cytometry analysis of BAL samples from Mtb infected NHPs prior to infection (black bars), four weeks post-infection (clear bars) and 12 weeks post-infection (striped bars). Comparison is shown for CD4+ T cells (A), CD8+ T cells (B), CD95+ T cells (C), CD69+ cells (D) and HLA-DR+ cells (E). Results are expressed as percent of total BAL cells.
Figure 2
Figure 2. Hierarchical and profile cluster analysis of the transcriptome of early and late granulomas.
Microarray analysis of genes expressed in a differential manner between normal lung, and granulomas from Mtb infected NHPs at week 4 and week 13, using hierarchical (A) as well as profile based (K-means) clustering (B). Clustering was performed using Spotfire DecisionSite for Functional Genomics, using data from triplicate biological samples. The coloring scheme for the hierarchical cluster is white -no change in expression, blue – lower expression in lesion samples relative to normal lung, and red – higher expression in lesion samples relative to normal lung. The hierarchical cluster is sorted by the results obtained by dividing the dataset into 10 distinct K-means clusters, with the right column showing the identical color scheme as the k-means clusters diagram.
Figure 3
Figure 3. Clustering analysis of specific immune categories.
Clustering analysis represents the differences in gene expression in early and late lesions between specific immune categories: chemokines and their receptors (A), cytokines and their receptors (B), IFNγ network (C) and TNF network (D). The coloring scheme is white -no change in expression, blue – lower expression in lesion samples relative to normal lung, and red – higher expression in lesion samples relative to normal lung. Each column represents results obtained from one distinct animal.
Figure 4
Figure 4. Reprogramming of lesion transcriptome occurs in late, relative to early granulomas.
Venn diagrams show the degree of overlap between commonly up regulated (A) and commonly down regulated (B) genes between week 4 and week 13 granuloma lesions. Similarly, overlap is also shown between genes up regulated in week 4 granulomas and down regulated in week 13 granulomas. Genes up regulated in various analyses are represented in red while those down regulated in various analyses are represented in green. The analyses included genes induced or repressed more than 2-fold in a statistically significant manner in all three “early” relative to “late” animals.
Figure 5
Figure 5. Confirmation of transcriptome results by RT-PCR.
Quantitative real-time Reverse-Transcriptase (RT-PCR) arrays specific for chemokines and their receptors were used to confirm microarray results. Biologically independent samples from all three “early” and “late” animals (different from those used in microarray experiment) were pooled into two groups, and duplicate analysis performed using PCR arrays. GAPDH was used as the invariant housekeeping control for normalization. Numeric fold changes reflect the following difference: [Gene x lesion lung (week 4 or week 13) – 18S RNA lesion lung (week 4 or week 13)] – [Gene x normal lung (week 4 or week 13) – 18S RNA lesion lung (week 4 or week 13)]. The expression of CCL25 was checked by conventional SyBr green RT-PCR, using the Applied Biosystems (Foster City, CA) Fast SYBR Green kit since it was not included in the PCR array. Data was analyzed in a manner comparable to PCR-arrays.
Figure 6
Figure 6. Confirmation of transcriptome results by confocal microscopy.
Confocal microscopy shows differential expression of pro-inflammatory cytokines IL6 (A) and TNFα (B) in week 4 (left panels) and week 13 (right panels) lesions. Immunofluorescence was performed on tissues obtained from two animals – one “early” and one “late” animal.

References

    1. Dye C. Global epidemiology of tuberculosis. Lancet. 2006;367:938–40. - PubMed
    1. Gandhi NR, Moll A, Sturm AW, Pawinski R, Govendar T, et al. Extensively drug-resistant tuberculosis as a cause of death in patients co-infected with tuberculosis and HIV in a rural area of South Africa. Lancet. 2006;368:1575–80. - PubMed
    1. Corbett EL, Watt CJ, Walker N, Maher D, Williams BG, et al. The growing burden of tuberculosis: global trends and interactions with the HIV epidemic. Arch Intern Med. 2003;163:1009–1021. - PubMed
    1. Orme IM. Prospects for new vaccines against tuberculosis. Trends Microbiol. 1995;3:401–4. - PubMed
    1. Basaraba RJ. Experimental tuberculosis: the role of comparative pathology in the discovery of improved tuberculosis treatment strategies. Tuberculosis. 2008;88(Suppl 1):S35–47. - PubMed

Publication types