. 2010 Nov;77(11):1020-31.
doi: 10.1002/cyto.a.20970.

Tyramide signal amplification for analysis of kinase activity by intracellular flow cytometry

Affiliations

Tyramide signal amplification for analysis of kinase activity by intracellular flow cytometry

Matthew R Clutter et al. Cytometry A. 2010 Nov.

Abstract

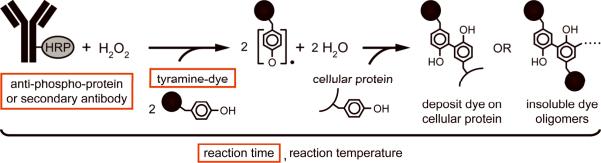
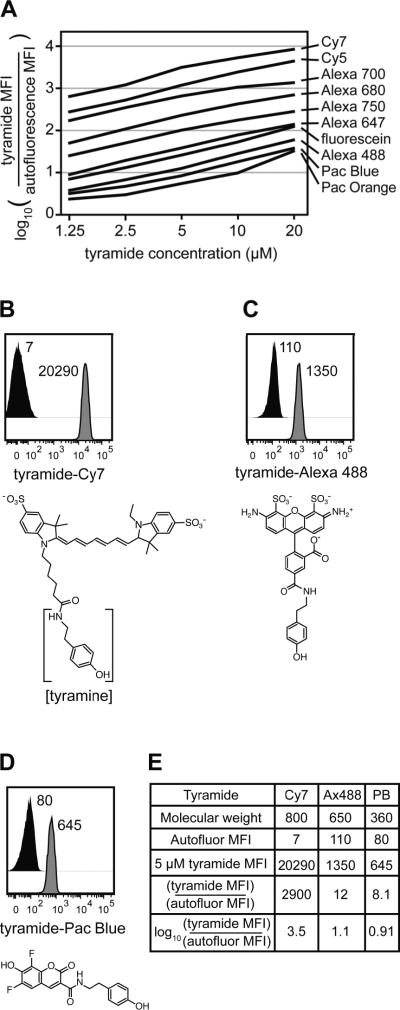
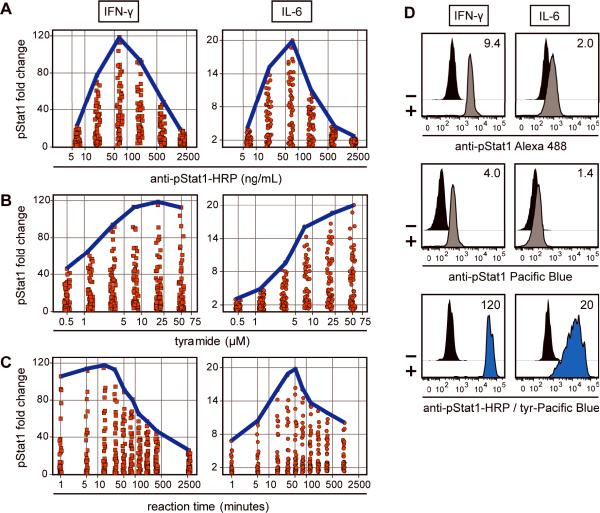
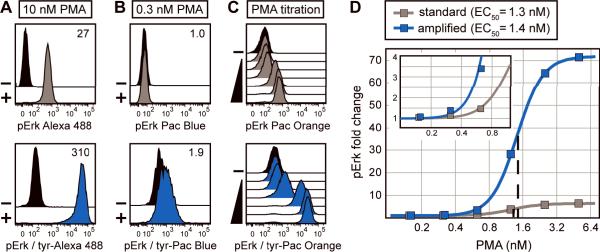
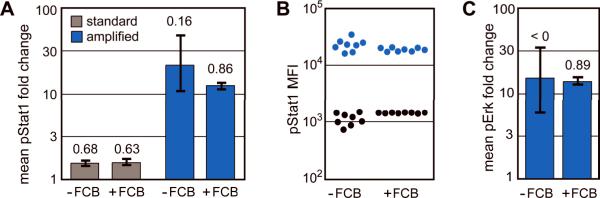
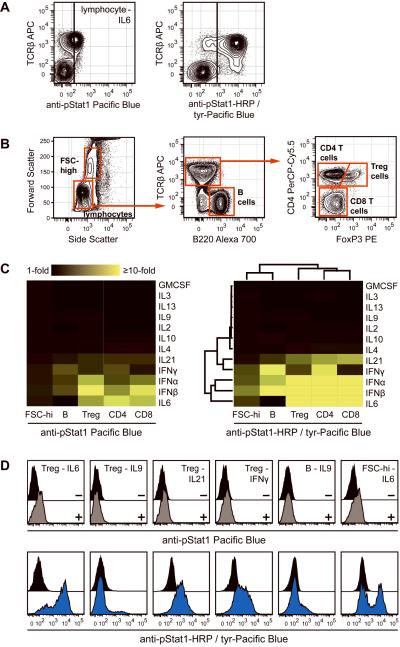
Intracellular flow cytometry permits quantitation of diverse molecular targets at the single-cell level. However, limitations in detection sensitivity inherently restrict the method, sometimes resulting in the inability to measure proteins of very low abundance or to differentiate cells expressing subtly different protein concentrations. To improve these measurements, an enzymatic amplification approach called tyramide signal amplification (TSA) was optimized for assessment of intracellular kinase cascades. First, Pacific Blue, Pacific Orange, and Alexa Fluor 488 tyramide reporters were shown to exhibit low nonspecific binding in permeabilized cells. Next, the effects of antibody concentration, tyramide concentration, and reaction time on assay resolution were characterized. Use of optimized TSA resulted in a 10-fold or greater improvement in measurement resolution of endogenous Erk and Stat cell signaling pathways relative to standard, nonamplified detection. TSA also enhanced assay sensitivity and, in conjunction with fluorescent cell barcoding, improved assay performance according to a metric used to evaluate high-throughput drug screens. TSA was used to profile Stat1 phosphorylation in primary immune system cells, which revealed heterogeneity in various populations, including CD4+ FoxP3+ regulatory T cells. We anticipate the approach will be broadly applicable to intracellular flow cytometry assays with low signal-to-noise ratios.


Figures

Figure 1
Figure 1
The TSA reaction and important variables. Antibodies labeled with HRP are used to detect specific intracellular targets like phospho-proteins in permeabilized cells. Alternatively, unlabeled antibodies are used in combination with secondary HRP-labeled antibodies. The concentration of HRP in a cell is thus proportional to target abundance. Tyramine, an HRP substrate, is covalently appended to a fluorescent dye suitable for flow cytometric detection to create a tyramide. In the presence of hydrogen peroxide, HRP oxidizes tyramide to form reactive free radicals that stably deposit onto local cellular macromolecules or that react with one another to form oligomeric precipitate. Over time, tyramides continuously deposit within a cell, which amplifies the fluorescent signal relative to what is achieved by standard staining methods. The reaction variables boxed in red were critical for TSA application to intracellular flow cytometry.
Figure 2
Figure 2
Fluorescent tyramides displayed diverse non-specific intracellular binding. (A) U937 cells were fixed, permeabilized, and incubated with different tyramide reporters at various concentrations. Non-specific tyramide binding was calculated relative to autofluorescence as log10((tyramide MFI)/(autofluorescence MFI)). (B) U937 cells were fixed, permeabilized, and incubated with or without 5 μM tyramide-Cy7 for 30 minutes in the absence of exogenous peroxidase and hydrogen peroxide. MFI values measured by flow cytometry for the tyramide (grey histogram) and for autofluorescence in the corresponding channel (black histogram) are reported. The structure of tyramide-Cy7 is below the plot with the tyramine portion in brackets. (C) Non-specific intracellular binding by 5 μM tyramide-Alexa Fluor 488 was assessed as in (B). (D) Non-specific intracellular binding by 5 μM tyramide-Pacific Blue was assessed as in (B). (E) Summary for Cy7, Alexa Fluor 488, and Pacific Blue tyramides demonstrating calculation of the non-specific binding metric reported in (A).
Figure 3
Figure 3
Antibody concentration, tyramide concentration, and reaction time were important TSA variables. (A) U937 cells were either unstimulated or stimulated with IFN-γ (left panel, square markers) or IL-6 (right panel, circle markers) and subjected to TSA under 360 different reaction conditions derived from concurrent titration of six anti-pStat1-HRP concentrations, six tyramide-Pacific Blue concentrations, and ten reaction times. pStat1 fold change values (MFISTIM / MFIUNSTIM) were plotted for different assay conditions at each discrete anti-pStat1-HRP concentration. The bold blue line indicates maximum assay resolution at a given anti-pStat1-HRP concentration. (B) Tyramide-Pacific Blue concentration was explored in a manner similar to anti-pStat1-HRP concentration in (A). (C) Reaction time was explored in a manner similar to anti-pStat1-HRP concentration in (A). (D) U937 cells were either unstimulated or stimulated with IFN-γ (left panels) or IL-6 (right panels) and stained with anti-pStat1 antibody conjugated to Alexa Fluor 488 (top panels), Pacific Blue (middle panels), or HRP (bottom panels). HRP-labeled cells were subjected to TSA under optimal conditions (IFN-γ: 70 ng/mL anti-pStat1-HRP, 20 μM tyramide-Pacific Blue, 15 minutes; IL-6: 70 ng/mL anti-pStat1-HRP, 50 μM tyramide-Pacific Blue, 50 minutes). MFIs of unstimulated (black histograms) and stimulated (grey and blue histograms) cells were used to calculate the pStat1 fold change values reported in each plot.
Figure 4
Figure 4
TSA is quantitative and has higher sensitivity than standard methods. (A) Jurkat cells were unstimulated (black histograms) or stimulated with 10 nM PMA to induce maximal Erk1/2 phosphorylation. pErk1/2 levels were detected with an unlabeled primary antibody followed by a secondary antibody labeled with either Alexa Fluor 488 (grey histogram) or HRP (blue histogram). HRP-stained cells were subjected to TSA with 20 μM tyramide-Alexa Fluor 488 for 60 minutes. pErk1/2 fold change values (MFISTIM / MFIUNSTIM) are reported in each plot. (B) Jurkat cells were stimulated with 0.3 nM PMA and low levels of pErk1/2 were detected and displayed as in (A). Amplification was performed with 8 μM tyramide-Pacific Blue for 10 minutes. (C) Jurkat cells were unstimulated or stimulated with various concentrations of PMA (from 0.15 μM to 10 μM) and levels of pErk1/2 were detected and displayed as in (A). Amplification was performed with 30 μM tyramide-Pacific Orange for 20 minutes. (D) pErk1/2 fold change values were calculated at each point in the PMA titration from (C) and plotted as a function of PMA concentration. PMA EC50 values were determined by logistic regression analysis for standard staining (grey curve, 1.3 nM) and TSA (blue curve, 1.4 nM). The inset shows data at low PMA concentrations.
Figure 5
Figure 5
Fluorescent cell barcoding (FCB) improves TSA assays. (A) Eight independent replicates of both unstimulated and IL-6 stimulated U937 cell samples were split for either individual sample processing or FCB. For FCB, the 16 replicates were labeled with unique fluorescent signatures and combined. The samples were then subjected to staining and flow cytometry to detect pStat1 with Pacific Blue dye using either standard methods or TSA (30 μM tyramide for 45 minutes). Mean pStat1 fold change values (mean MFISTIM / mean MFIUNSTIM) were calculated for standard staining (grey bars) and TSA (blue bars). For each assay the range of pStat1 fold change values (eight stimulated samples each compared to eight unstimulated samples) is marked with a black range bar. Z′-factors are reported above the bars. Higher Z′ values correspond to better assay reproducibility. (B) pStat1 MFI values of the eight unstimulated (black) and eight stimulated (blue) samples subjected to TSA as described in (A) were plotted. The data are spread horizontally to show sample variance. (C) Eight independent replicates of both unstimulated and PMA stimulated U937 cells were split for either individual sample processing or FCB. Samples were stained with pErk1/2 detection antibody followed by HRP-labeled secondary antibody and were subjected to TSA (20 μM tyramide-Pacific Blue for 10 minutes). Fold change ranges and Z′-factors are displayed as described in (A).
Figure 6
Figure 6
Stat1 activation profiling in primary mouse splenocytes. (A) Splenocytes were stimulated with IL-6 and stained with TCRβ antibody to identify T cells. Standard staining (left panel) or TSA (right panel) were used to measure Stat1 phosphorylation. TCRβ-negative non-responding cell populations determined the black vertical activation bounds in each plot. (B) Gating strategy for mouse splenocyte populations. A high forward scatter population (composed primarily of monocytes and granulocytes) and a low forward scatter population (lymphocytes) were gated first. Within the lymphocytes, TCRβ+ B220− T cells and B220+ TCRβ− B cells were gated. Within T cells, CD4− FoxP3− cells (CD8 T cells), CD4+ FoxP3− cells (CD4 T cells), and CD4+ FoxP3+ cells (regulatory T cells) were identified. (C) Splenocytes were stimulated with the cytokines listed alongside the heat maps and standard staining (left panel) or TSA (right panel) were used to measure Stat1 activation in the five cell populations from (B). TSA-based pStat1 measurements were used for hierarchical clustering to understand the relatedness of cytokines and cell populations to one another. (D) Certain data from the pStat1 fingerprint are displayed to show that TSA (bottom row, blue histograms) but not standard staining (top row, grey histograms) identified underlying heterogeneity within cell populations. Black histograms were unstimulated cells.

References

    1. Bauer KD, Jacobberger JW. Analysis of intracellular proteins. Methods Cell Biol. 1994;41:351–76. - PubMed
    1. Krutzik PO, Nolan GP. Intracellular phospho-protein staining techniques for flow cytometry: monitoring single cell signaling events. Cytometry A. 2003;55A:61–70. - PubMed
    1. Schulz KR, Danna EA, Krutzik PO, Nolan GP. Single-cell phospho-protein analysis by flow cytometry. Curr Protoc Immunol. 2007;Chapter 8(Unit 8):17. - PubMed
    1. Lamoreaux L, Roederer M, Koup R. Intracellular cytokine optimization and standard operating procedure. Nat Protoc. 2006;1:1507–16. - PubMed
    1. Perez OD, Nolan GP. Simultaneous measurement of multiple active kinase states using polychromatic flow cytometry. Nat Biotechnol. 2002;20:155–62. - PubMed

Publication types

MeSH terms