

Excess mortality in patients with AIDS in the era of highly active antiretroviral therapy: temporal changes and risk factors
- PMID: 20825306
- PMCID: PMC2943970
- DOI: 10.1086/656415
Excess mortality in patients with AIDS in the era of highly active antiretroviral therapy: temporal changes and risk factors
Abstract
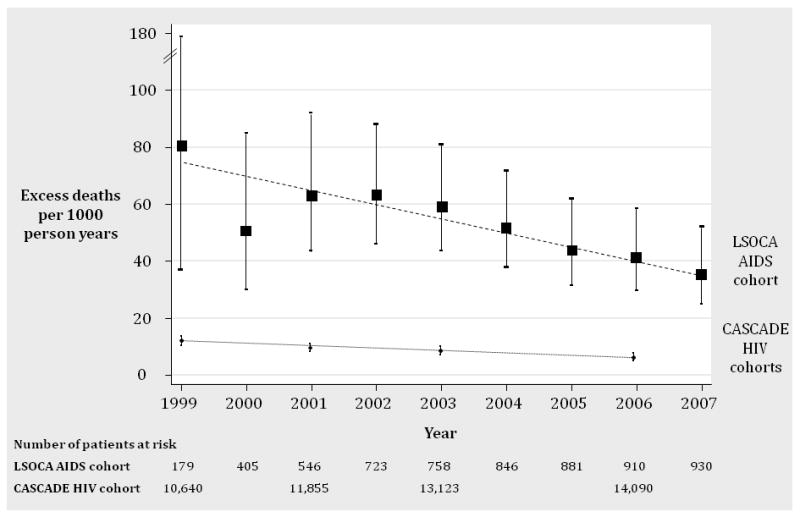
Background: Excess mortality has decreased among human immunodeficiency virus (HIV)-infected patients but without evidence of a decrease among patients with AIDS. We assessed temporal changes in excess mortality and elucidated risk factors for excess mortality in patients with AIDS diagnosed in the era of highly active antiretroviral therapy (HAART).
Methods: We included 1188 patients of the Longitudinal Study of Ocular Complications in AIDS who were aged 25-64 years at enrollment and who received a diagnosis of AIDS after 1995. We calculated excess mortality as the age-, year-, and sex-adjusted difference in mortality rates between patients with AIDS and persons in the US general population during the period 1999-2007. We used a relative survival model to identify risk factors for excess mortality.
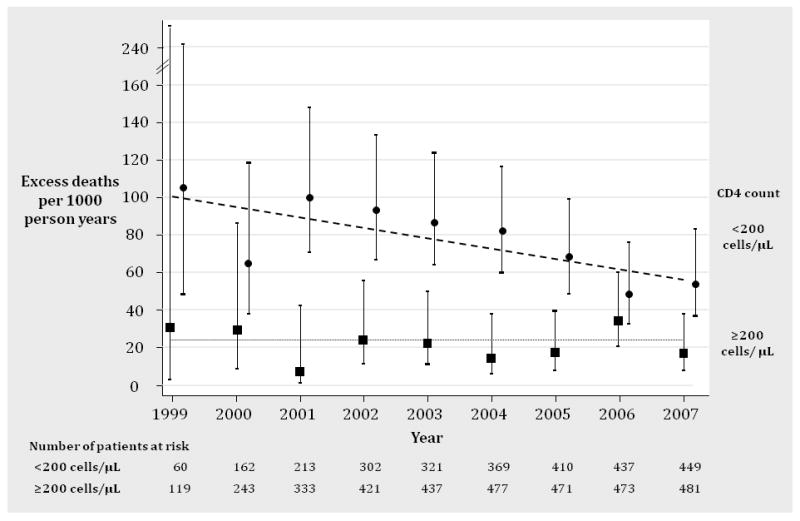
Results: There were a mean of 50 excess deaths per 1000 person-years (95% confidence interval [CI], 44-57 excess deaths per 1000 person-years) during 1999-2007. Excess mortality almost halved, with an annual decrease of 8.0% per year (95% CI, 3.0%-12.7%; P = .002) but remained high at 36 excess deaths per 1000 person-years in 2007. Viral load >400 copies/mL (compared with <or= 400 copies/mL; risk ratio, 3.4; 95% CI, 2.3-5.0), CD4(+) count <200 cells/μL (compared with >or= 200 cells/μL; risk ratio, 2.7; 95% CI, 1.9-3.9), and cytomegalovirus retinitis (risk ratio, 1.6; 95% CI, 1.2-2.1) were the strongest risk factors for excess mortality.
Conclusions: Excess mortality among patients with AIDS was nearly halved in the HAART era and most strongly linked to stage of HIV disease. These results reflect the continuing improvements in AIDS management but also highlight that excess mortality remains ∼5 times higher in patients with AIDS than in HIV-infected patients without AIDS.
Conflict of interest statement
Figures
Similar articles
-
Universal decline in mortality in patients with advanced HIV-1 disease in various demographic subpopulations after the introduction of HAART in Hong Kong, from 1993 to 2002.HIV Med. 2006 Apr;7(3):186-92. doi: 10.1111/j.1468-1293.2006.00352.x. HIV Med. 2006. PMID: 16494633
-
Influenza-related mortality among adults aged 25-54 years with AIDS in South Africa and the United States of America.Clin Infect Dis. 2012 Oct;55(7):996-1003. doi: 10.1093/cid/cis549. Epub 2012 Jun 19. Clin Infect Dis. 2012. PMID: 22715173 Free PMC article.
-
Ten-year mortality trends among persons diagnosed with HIV infection in England and Wales in the era of antiretroviral therapy: AIDS remains a silent killer.HIV Med. 2013 Nov;14(10):596-604. doi: 10.1111/hiv.12045. Epub 2013 May 15. HIV Med. 2013. PMID: 23672663
-
Causes of death among women with human immunodeficiency virus infection in the era of combination antiretroviral therapy.Am J Med. 2002 Aug 1;113(2):91-8. doi: 10.1016/s0002-9343(02)01169-5. Am J Med. 2002. PMID: 12133746 Free PMC article.
-
Causes of the decline in AIDS deaths, United States, 1995-2002: prevention, treatment or both?Int J STD AIDS. 2005 Dec;16(12):777-81. doi: 10.1258/095646205774988109. Int J STD AIDS. 2005. PMID: 16336756 Review.
Cited by
-
Do people with HIV infection have a normal life expectancy in the era of combination antiretroviral therapy?BMC Med. 2013 Nov 27;11:251. doi: 10.1186/1741-7015-11-251. BMC Med. 2013. PMID: 24283830 Free PMC article. Review.
-
Correlates of hypertension in patients with AIDS in the era of highly active antiretroviral therapy.J Int Assoc Provid AIDS Care. 2013 Sep-Oct;12(5):325-33. doi: 10.1177/2325957413491432. J Int Assoc Provid AIDS Care. 2013. PMID: 23764503 Free PMC article.
-
Interleukin gene polymorphisms and susceptibility to HIV-1 infection: a meta-analysis.J Genet. 2018 Mar;97(1):235-251. J Genet. 2018. PMID: 29666343
-
Secular trends in opportunistic infections, cancers and mortality in patients with AIDS during the era of modern combination antiretroviral therapy.HIV Med. 2018 Jul;19(6):411-419. doi: 10.1111/hiv.12609. Epub 2018 Mar 24. HIV Med. 2018. PMID: 29573311 Free PMC article.
-
Complex care needs of patients with late-stage HIV disease: a retrospective study.AIDS Care. 2014;26(3):320-5. doi: 10.1080/09540121.2013.819404. AIDS Care. 2014. Retraction in: AIDS Care. 2013;25(6):793. doi: 10.1080/09540121.2012.754979. PMID: 23869624 Free PMC article. Retracted.
References
-
- Bhaskaran K, Hamouda O, Sannes M, Boufassa F, Johnson AM, Lambert PC, et al. Changes in the risk of death after HIV seroconversion compared with mortality in the general population. JAMA. 2008 Jul 2;300(1):51–9. - PubMed
-
- Ewings FM, Bhaskaran K, McLean K, Hawkins D, Fisher M, Fidler S, et al. Survival following HIV infection of a cohort followed up from seroconversion in the UK. AIDS. 2008 Jan 2;22(1):89–95. - PubMed
-
- Jaggy C, von Overbeck J, Ledergerber B, Schwarz C, Egger M, Rickenbach M, et al. Mortality in the Swiss HIV Cohort Study (SHCS) and the Swiss general population. Lancet. 2003 Sep 13;362(9387):877–8. - PubMed
-
- Lohse N, Hansen AB, Pedersen G, Kronborg G, Gerstoft J, Sorensen HT, et al. Survival of persons with and without HIV infection in Denmark, 1995-2005. Ann Intern Med. 2007 Jan 16;146(2):87–95. - PubMed
-
- Palella FJ, Jr, Baker RK, Moorman AC, Chmiel JS, Wood KC, Brooks JT, et al. Mortality in the highly active antiretroviral therapy era: changing causes of death and disease in the HIV outpatient study. J Acquir Immune Defic Syndr. 2006 Sep;43(1):27–34. - PubMed
Publication types
MeSH terms
Substances
Grants and funding
- 5MO1RR 00865/RR/NCRR NIH HHS/United States
- 5MO1 RR00047/RR/NCRR NIH HHS/United States
- U01 AI 27660/AI/NIAID NIH HHS/United States
- U01 AI025903/AI/NIAID NIH HHS/United States
- U10 EY008057/EY/NEI NIH HHS/United States
- U10 EY008052/EY/NEI NIH HHS/United States
- U01AI 276670/AI/NIAID NIH HHS/United States
- M01 RR000043/RR/NCRR NIH HHS/United States
- M01 RR00096/RR/NCRR NIH HHS/United States
- 5M01 RR00046/RR/NCRR NIH HHS/United States
- M01 RR000096/RR/NCRR NIH HHS/United States
- M01 RR000046/RR/NCRR NIH HHS/United States
- U01 AI 25903/AI/NIAID NIH HHS/United States
- 5MO1 RR 00043/RR/NCRR NIH HHS/United States
- U10 EY 08052/EY/NEI NIH HHS/United States
- 5MO1 RR 05280/RR/NCRR NIH HHS/United States
- U01 AI 27674/AI/NIAID NIH HHS/United States
- U01 AI027663/AI/NIAID NIH HHS/United States
- M01 RR000865/RR/NCRR NIH HHS/United States
- U01 AI 25858/AI/NIAID NIH HHS/United States
- MO1 RR 00052/RR/NCRR NIH HHS/United States
- 5MO1 RR 00188/RR/NCRR NIH HHS/United States
- M01 RR000188/RR/NCRR NIH HHS/United States
- M01 RR000047/RR/NCRR NIH HHS/United States
- U10 EY 08067/EY/NEI NIH HHS/United States
- U01 AI027660/AI/NIAID NIH HHS/United States
- M01 RR005096/RR/NCRR NIH HHS/United States
- M01 RR000052/RR/NCRR NIH HHS/United States
- U10 EY 08057/EY/NEI NIH HHS/United States
- U10 EY008067/EY/NEI NIH HHS/United States
- U01AI 32783/AI/NIAID NIH HHS/United States
- U01 AI032783/AI/NIAID NIH HHS/United States
- U01 AI 27663/AI/NIAID NIH HHS/United States
- 5MO1RR 05096/RR/NCRR NIH HHS/United States
LinkOut - more resources
Full Text Sources
Medical
Research Materials
