. 2010 Nov 15;432(1):9-19.
doi: 10.1042/BJ20100308.

Prevention of diabetic nephropathy in Ins2(+/)⁻(AkitaJ) mice by the mitochondria-targeted therapy MitoQ

Affiliations

Prevention of diabetic nephropathy in Ins2(+/)⁻(AkitaJ) mice by the mitochondria-targeted therapy MitoQ

Balu K Chacko et al. Biochem J. .

Abstract

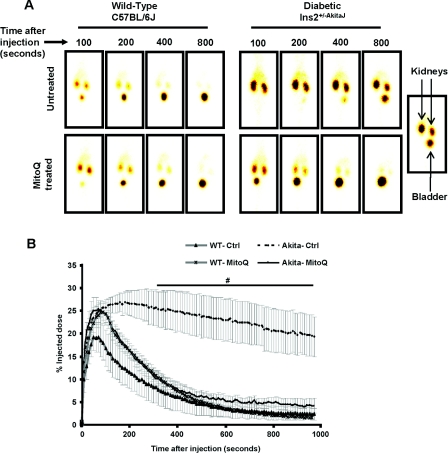
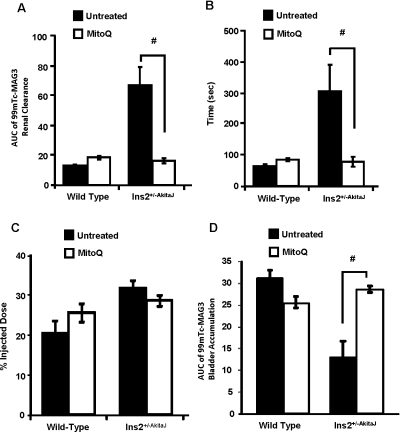
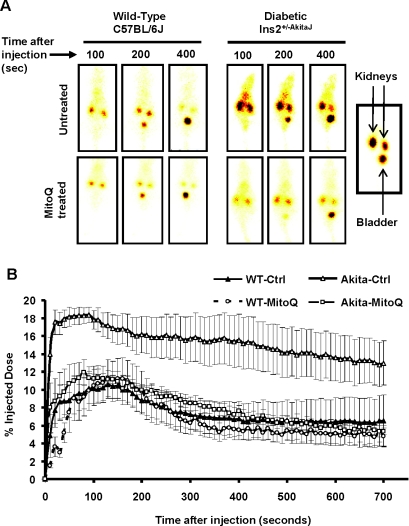
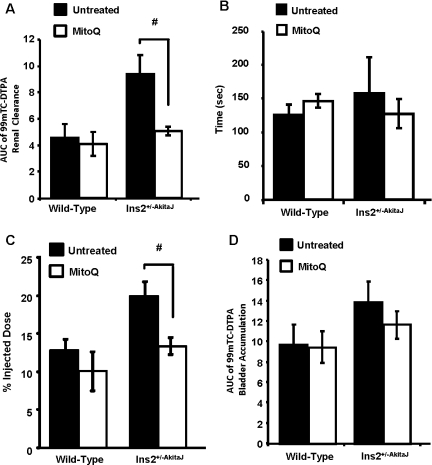
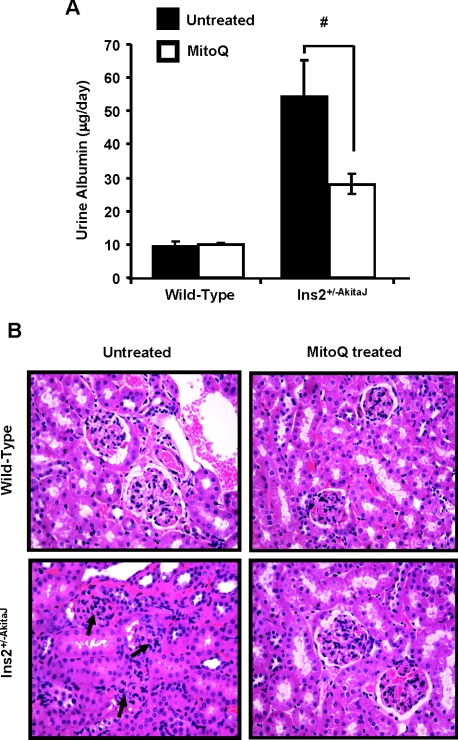
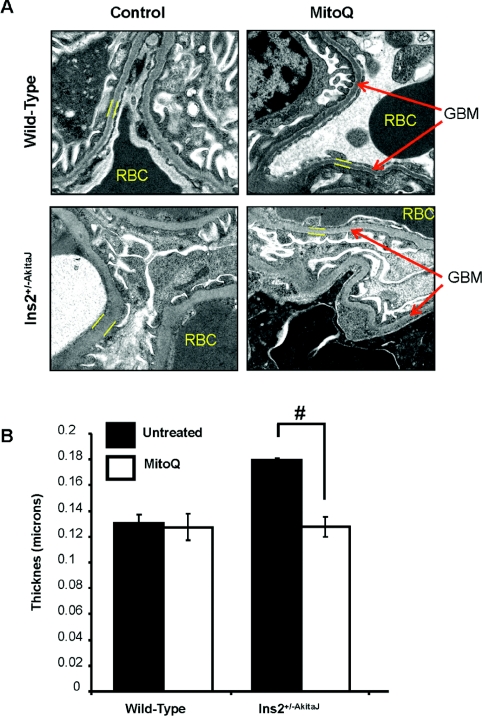
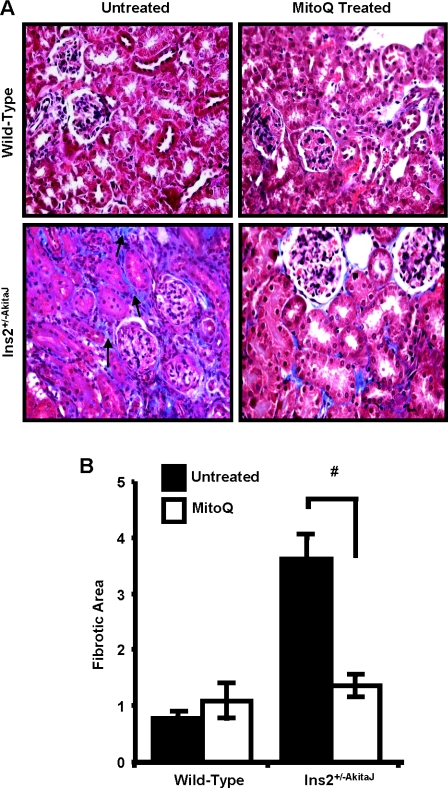
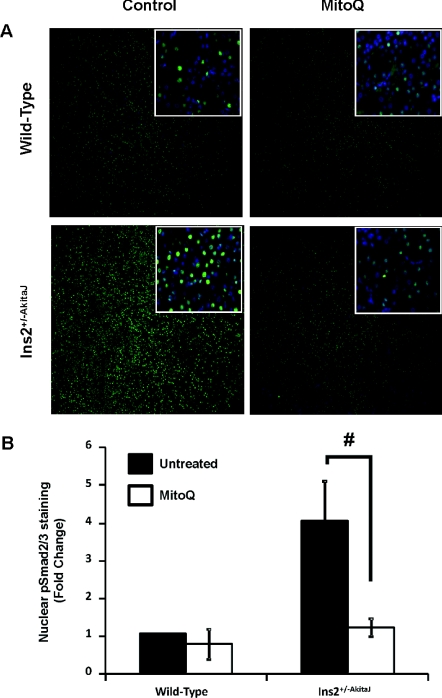
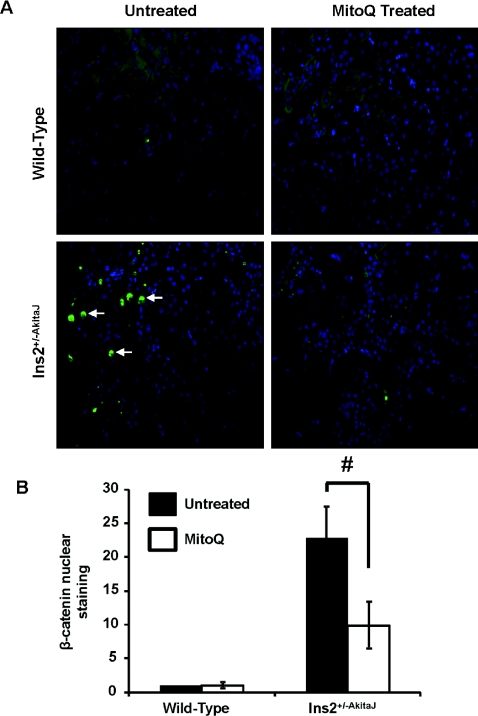
Mitochondrial production of ROS (reactive oxygen species) is thought to be associated with the cellular damage resulting from chronic exposure to high glucose in long-term diabetic patients. We hypothesized that a mitochondria-targeted antioxidant would prevent kidney damage in the Ins2(+/)⁻(AkitaJ) mouse model (Akita mice) of Type 1 diabetes. To test this we orally administered a mitochondria-targeted ubiquinone (MitoQ) over a 12-week period and assessed tubular and glomerular function. Fibrosis and pro-fibrotic signalling pathways were determined by immunohistochemical analysis, and mitochondria were isolated from the kidney for functional assessment. MitoQ treatment improved tubular and glomerular function in the Ins2(+/)⁻(AkitaJ) mice. MitoQ did not have a significant effect on plasma creatinine levels, but decreased urinary albumin levels to the same level as non-diabetic controls. Consistent with previous studies, renal mitochondrial function showed no significant change between any of the diabetic or wild-type groups. Importantly, interstitial fibrosis and glomerular damage were significantly reduced in the treated animals. The pro-fibrotic transcription factors phospho-Smad2/3 and β-catenin showed a nuclear accumulation in the Ins2(+/)⁻(AkitaJ) mice, which was prevented by MitoQ treatment. These results support the hypothesis that mitochondrially targeted therapies may be beneficial in the treatment of diabetic nephropathy. They also highlight a relatively unexplored aspect of mitochondrial ROS signalling in the control of fibrosis.


Figures

Figure 1
Figure 1. MitoQ treatment prevents renal tubular dysfunction in Ins2+/−AkitaJ mice as determined by 99mTc–MAG3 clearance
(A) Real-time images of the mice after the tail-vein injection of the radioactive tracer 99mTc–MAG3. Upon injection the tracer accumulates and then clears out of the kidney to the urinary bladder. The presence of radioactivity is detected using a gamma camera. (B) Means±S.E.M. (n=5–8) of the original traces of the dye accumulation and clearance profile in the kidneys relative to the amount of the dye present in the whole body from non-diabetic wild-type (WT) and diabetic Ins2+/−AkitaJ mice (Akita), with (MitoQ) or without (Ctrl) MitoQ treatment. Statistical comparison was performed with ANOVA and the Newman–Keuls test. #P≤0.05 relative to the MitoQ-treated Ins2+/−AkitaJ group.
Figure 2
Figure 2. Protection of renal tubular function by MitoQ in Ins2+/−AkitaJ mice
(A) Quantification of the 99mTc–MAG3 renal clearance profile calculated as the AUC from individual animals up to 600 s from the tracer administration. (B) Time taken to reach the peak accumulation and (C) peak tracer accumulation value of the 99mTc–MAG3 renal clearance analysis. (D) Accumulation of the tracer in the urinary bladder was also determined as the AUC up to 10 min from the time of injection. Results are means±S.E.M. (n=5–8). Statistical comparison was performed with ANOVA and the Newman–Keuls test. #P≤0.05.
Figure 3
Figure 3. MitoQ protects against diabetic glomerular dysfunction in Ins2+/−AkitaJ mice as determined by the 99mTc-DTPA clearance
(A) Representative real-time images of the whole animal at various time points during the study are shown. (B) Means±S.E.M. (n=4–6) of the profiles demonstrating the uptake and clearance phases of the 99mTc–DTPA radioactive tracer in the right kidney after injection through the tail vein by analysing the real-time images from non-diabetic wild-type (WT) and diabetic Ins2+/−AkitaJ mice (Akita), with (MitoQ) or without (Ctrl) MitoQ treatment.
Figure 4
Figure 4. Preservation of glomerular function by MitoQ in Ins2+/−AkitaJ mice
(A) Quantification of the 99mTc–DTPA renal clearance profile calculated as the AUC from individual animals up to 10 min from the tracer administration. (B) Time taken to reach peak accumulation of tracer in the kidney. (C) The amount of the radioactive tracer at the time of peak accumulation in the right kidney after 99mTc–DTPA injection was calculated. (D) The peak accumulation values of the DTPA clearance analysis were determined from the profile curve plotted with the percentage injected dose against time. Results are means±S.E.M (n=4–6). Statistical comparison was performed with ANOVA and the Newman–Keuls test. #P≤0.05.
Figure 5
Figure 5. MitoQ treatment decreases albuminuria in diabetic Ins2+/−AkitaJ mice
(A) The albumin levels of the 24-h-urine samples were estimated using the mouse urine albumin ELISA kit and the total amount of albumin excreted per day was measured. Results are means±S.E.M. (n=6–8) as analysed by ANOVA and the Newman–Keuls test. #P≤0.05. (B) Renal tissue morphology in diabetic Ins2+/−AkitaJ mice was significantly improved by oral MitoQ treatment. Representative images of haematoxylin/eosin-stained renal sections show significant improvement in diabetes-induced glomerular injury in Ins2+/−AkitaJ mice.
Figure 6
Figure 6. MitoQ decreases GBM thickening in Akita mice
(A) Representative transmission electron micrographs (viewed at 6500×) of the renal tissues demonstrating thickening of the GBM in Akita mice compared with the wild-type controls. MitoQ treatment prevented GBM thickening in Akita mice. (B). Quantification of the GBM thickening using Simple PCI software. The mean thickness (n=3, per group) was calculated, analysed by ANOVA and the Newman–Keuls test and expressed (± S.E.M). #P≤0.05.
Figure 7
Figure 7. MitoQ treatment decreases diabetes-induced renal interstitial fibrosis
(A) Paraffin-embedded sections were prepared from paraformaldehyde-fixed tissues and stained with Masson's Trichrome for tissue collagen and imaged using Simple PCI software. (B) PASR-stained renal sections were imaged and quantified using Image-Pro plus. Average fibrotic area values were determined from one-half of the kidney cross-section (n=8–9 per group), means values were analysed by ANOVA and the Newman–Keuls test test and expressed (± S.E.M). #P≤0.05.
Figure 8
Figure 8. MitoQ treatment inhibits phospho-Smad2/3-mediated signalling in the diabetic kidney
(A) Paraffin-embedded sections were prepared from paraformaldehyde-fixed tissues and stained with anti-phopho-Smad2/3 antibody linked to Alexa Fluor® 488 (green); the nuclei were stained with DAPI (4′,6-diamidino-2-phenylindole; blue). Sections were imaged using Simple PCI software. (B) Images were quantified for phospho-Smad2/3 localization in the nucleus using Simple PCI software. Mean green intensities (n=6, per group) were calculated, analysed by ANOVA and the Newman–Keuls test and expressed (± S.E.M). #P≤0.05.
Figure 9
Figure 9. MitoQ treatment decreases β-catenin nuclear translocation in the Ins2+/−AkitaJ kidney
(A) Representative images demonstrating translocation of activated β-catenin in the nucleus. Immunohistochemical analysis showed increased β-catenin in the nucleus of diabetic mice when probed with an anti-β-catenin antibody linked to Alexa Fluor® 488 (green) and DAPI (4′,6-diamidino-2-phenylindole) counter-stain (blue). (B) Quantification of immunohistochemical images showed a significant increase in nuclear β-catenin intensity in diabetic mice compared with the wild-type controls, which was significantly decreased with MitoQ treatment (n=6). Mean green intensities (n=6, per group) were calculated, analysed by ANOVA and the Newman–Keuls test and expressed (±S.E.M). #P≤0.05.

References

    1. US Renal Data System. Annual Data Report. Bethesda, MD: The National Institutes of Health, National Institute of Diabetes and Digestive and Kidney Diseases; 2008.
    1. Ayodele O. E., Alebiosu C. O., Salako B. L. Diabetic nephropathy: a review of the natural history, burden, risk factors and treatment. J. Natl. Med. Assoc. 2004;96:1445–1454. - PMC - PubMed
    1. Kanwar Y. S., Wada J., Sun L., Xie P., Wallner E. I., Chen S., Chugh S., Danesh F. R. Diabetic nephropathy: mechanisms of renal disease progression. J. Exp. Med. 2008;233:4–11. - PubMed
    1. Brownlee M. Biochemistry and molecular cell biology of diabetic complications. Nature. 2001;414:813–820. - PubMed
    1. Green K., Brand M. D., Murphy M. P. Prevention of mitochondrial oxidative damage as a therapeutic strategy in diabetes. Diabetes. 2004;53(Suppl. 1):S110–S118. - PubMed

Publication types

MeSH terms