

Simple and flexible classification of gene expression microarrays via Swirls and Ripples
- PMID: 20825641
- PMCID: PMC2949887
- DOI: 10.1186/1471-2105-11-452
Simple and flexible classification of gene expression microarrays via Swirls and Ripples
Abstract
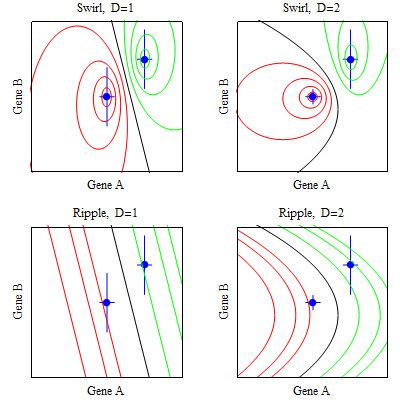
Background: A simple classification rule with few genes and parameters is desirable when applying a classification rule to new data. One popular simple classification rule, diagonal discriminant analysis, yields linear or curved classification boundaries, called Ripples, that are optimal when gene expression levels are normally distributed with the appropriate variance, but may yield poor classification in other situations.
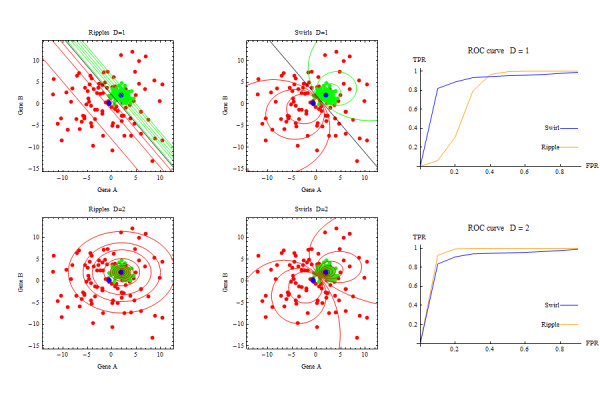
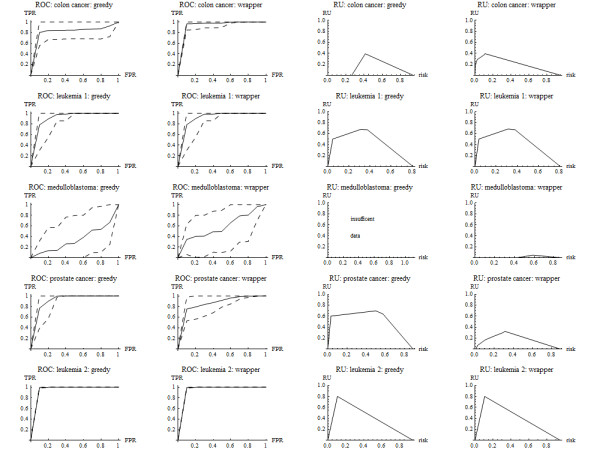
Results: A simple modification of diagonal discriminant analysis yields smooth highly nonlinear classification boundaries, called Swirls, that sometimes outperforms Ripples. In particular, if the data are normally distributed with different variances in each class, Swirls substantially outperforms Ripples when using a pooled variance to reduce the number of parameters. The proposed classification rule for two classes selects either Swirls or Ripples after parsimoniously selecting the number of genes and distance measures. Applications to five cancer microarray data sets identified predictive genes related to the tissue organization theory of carcinogenesis.
Conclusion: The parsimonious selection of classifiers coupled with the selection of either Swirls or Ripples provides a good basis for formulating a simple, yet flexible, classification rule. Open source software is available for download.
Figures
References
-
- Hand DJ. Classifier technology and the illusion of progress. Stat Sci. 2006;21:1–14. doi: 10.1214/088342306000000060. - DOI
-
- Dudoit S, Fridlyand J, Speed TP. Comparison of discrimination methods for the classification of tumors using gene expression data. J Am Stat Assoc. 2002;97:77–87. doi: 10.1198/016214502753479248. - DOI
-
- Lachenbruch PA, Goldstein M. Discriminant analysis. Biometrics. 1979;35:69–85. doi: 10.2307/2529937. - DOI
-
- Stekel D. Microarray Bioinformatics. Cambridge: Cambridge University Press; 2003.
-
- Hand DJ. In: Encylopedia of Biostatistics. Peter Armitage and Theodore Colton, editor. Vol. 2. Chichester: John Wiley and Sons; 1998. Discriminant analysis, linear; pp. 1168–1179.
Publication types
MeSH terms
LinkOut - more resources
Full Text Sources
