. 2010 Sep 9;67(5):885-96.
doi: 10.1016/j.neuron.2010.08.004.

Differences in gamma frequencies across visual cortex restrict their possible use in computation

Affiliations

Differences in gamma frequencies across visual cortex restrict their possible use in computation

Supratim Ray et al. Neuron. .

Abstract

Neuronal oscillations in the gamma band (30-80 Hz) have been suggested to play a central role in feature binding or establishing channels for neural communication. For these functions, the gamma rhythm frequency must be consistent across neural assemblies encoding the features of a stimulus. Here we test the dependence of gamma frequency on stimulus contrast in V1 cortex of awake behaving macaques and show that gamma frequency increases monotonically with contrast. Changes in stimulus contrast over time leads to a reliable gamma frequency modulation on a fast timescale. Further, large stimuli whose contrast varies across space generate gamma rhythms at significantly different frequencies in simultaneously recorded neuronal assemblies separated by as little as 400 microm, making the gamma rhythm a poor candidate for binding or communication, at least in V1. Instead, our results suggest that the gamma rhythm arises from local interactions between excitation and inhibition.


Figures

Figure 1
Figure 1
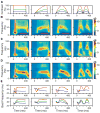
Gamma rhythm frequency is highly contrast dependent. A) Average multi-unit (upper panel) and evoked LFP response (lower panel) recorded from a single site in Monkey 1 during the presentation of a static Gabor stimulus (0 to 400 ms), at three different contrasts: 25% (blue trace), 50% (green) and 100% (red). B) Time-frequency energy difference plots (in dB) showing the difference in energy from baseline energy (-300 to 0 ms, 0 denotes the stimulus onset, difference computed separately for each frequency) for the 25% (left panel), 50% (middle) and 100% (right) contrast. During the first 100 ms, there is a broadband increase in power that is associated with the sharp increase in firing rate as shown in A. The gamma rhythm (horizontal red band) is visible only after ∼100 ms and the center frequency increases with contrast. C) The LFP energy between 200-400 ms (denoted by a thick black line on the x-axis in B) as a function of frequency for the three contrasts. The black line shows the LFP energy in the baseline period. The inset shows the gamma frequency (the frequency between 20-60 Hz that has the maximum power difference from baseline) as a function of stimulus contrast. The black line in the inset shows the linear regression fit. Figure D-F and G-I show corresponding population responses of 63 and 90 sites from Monkey 1 and 2, respectively. For D and G, the responses are normalized by dividing by the maximum firing rate or evoked response for each site. The SEM for the insets in F and I are smaller than the size of the symbols.
Figure 2
Figure 2
Relationship between spikes and LFPs as a function of contrast. All analyses are shown for the interval between 150-406 ms post stimulus onset. A) The average LFP-LFP coherence between 198 and 234 pairs of electrodes for Monkeys 1 and 2, whose receptive fields were within 0.2 degrees of the stimulus center. B) Phase histograms of the LFP-LFP coherence values at peak gamma frequencies, indicated by inverted triangles in A. C) Average spike-LFP coherence between 185 and 155 pairs of electrodes in Monkeys 1 and 2, whose receptive fields were within 0.2 degrees of the stimulus center. D) Phase histograms of the spike-LFP coherence values at peak gamma frequencies, indicated by inverted triangles in C. E) Spike-triggered LFP average. Time of the spike (0 ms) is shown by a dotted line for clarity. F) Probability of a spike as a function of the phase of the gamma cycle. The gamma cycle is shown in gray. The trough of the gamma cycle (180°) is shown by a dotted line for clarity.
Figure 3
Figure 3
Changing contrast over time modulates gamma frequency. A) Four different contrast profiles, with temporal frequency of (from left to right) 0, 0.625, 1.25 and 2.5 Hz. B, C) The average time-frequency energy difference for the 100% maximum contrast stimulus (red traces in A) for Monkey 1 (44 sites, B) and Monkey 2 (90 sites, C). Gamma frequency shows a pronounced modulation as the contrast changes over time. D) Same as C, but for the 50% maximum contrast stimulus (green trace in A) for Monkey 2. E) The average gamma oscillation frequency for Monkey 1 (upper panel; only 100% (red) and 25% (blue) contrasts were used for this monkey) and Monkey 2 (lower panel). The standard errors were of the order of the thickness of the lines and were omitted for clarity.
Figure 4
Figure 4
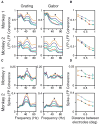
A stimulus whose contrast varies in space generates gamma rhythms at different frequencies in different neuronal assemblies. A) A grating of radius 1.56° (upper left) and a Gabor with a SD of 0.52° (upper right), both of 100% contrast at the center, along with the receptive fields of three sites at different distances from the stimulus center. The lower panels show the power spectra of the LFP (between 150-406 ms post stimulus onset) recorded from the three electrodes whose receptive fields are shown in the upper row. The black line shows the average LFP power during baseline. The LFPs show oscillations at different gamma frequencies depending on the distance between the receptive field center and the stimulus center for the Gabor stimulus (lower right), but not for the grating (lower left). B) Average population power spectra for different distances between the receptive field center and the stimulus center (binned at 0.2°), for the grating (left column) and Gabor (right column) stimulus, for Monkey 1 (upper row) and Monkey 2 (lower row). The five colored traces correspond to different distances, shown in the upper left panel. The black trace shows the power in the baseline period. See text for more details. C) Average gamma oscillation frequencies as a function of the distance between the receptive field and stimulus center for Monkey 1 (upper plot) and Monkey 2 (lower plot), for grating (open circles) and Gabor (closed circles) stimuli. Error bars are SEM and when not shown are smaller than the size of the symbols. The brown line indicates the estimated frequency by computing the effective contrast (the contrast within each of the receptive fields) for the Gabor stimuli and using the frequency versus contrast slopes shown in the inset of Figure 1F and I. The horizontal gray line shows the expected frequency for a grating stimulus, which should not vary with distance since the contrast remains constant. For Monkey 2 the frequency actually increases slightly, due to a decrease in the effective size of the stimulus. See text for more details.
Figure 5
Figure 5
Comparison of LFP-LFP and spike-LFP coherence for grating versus Gabor stimuli. A) Population LFP-LFP coherence spectra for different degree of separation between two electrodes. The five colored traces correspond to different electrode separations, shown in the upper left panel of Figure 4B. One of the electrodes in each pair is within 0.2 degrees of the stimulus center. B) The average LFP-LFP coherence at the peak gamma frequency, shown by inverted triangles in A. Coherence values for the grating and Gabor stimuli are shown with open and filled circles, respectively. The circles are connected with a gray (grating) and brown (Gabor) line for clarity. C-D) Same as A-B, but for spike-LFP coherence. The electrode from which spikes were taken for each pair was within 0.2° of the stimulus center. See text for more details.

Similar articles

Cited by

References

    1. Atallah BV, Scanziani M. Instantaneous modulation of gamma oscillation frequency by balancing excitation with inhibition. Neuron. 2009;62:566–577. - PMC - PubMed
    1. Bartos M, Vida I, Jonas P. Synaptic mechanisms of synchronized gamma oscillations in inhibitory interneuron networks. Nat Rev Neurosci. 2007;8:45–56. - PubMed
    1. Berens P, Velasco MJ. MPI Technical Report No 184. 2009.
    1. Brunel N, Wang XJ. What determines the frequency of fast network oscillations with irregular neural discharges? I. Synaptic dynamics and excitation-inhibition balance. J Neurophysiol. 2003;90:415–430. - PubMed
    1. Burns SP, Xing D, Shelley MJ, Shapley RM. Searching for autocoherence in the cortical network with a time-frequency analysis of the local field potential. J Neurosci. 2010;30(11):4033–47. - PMC - PubMed

Publication types