. 2010 Oct 1;123(Pt 19):3378-88.
doi: 10.1242/jcs.068841. Epub 2010 Sep 7.

AT-1 is the ER membrane acetyl-CoA transporter and is essential for cell viability

Affiliations

AT-1 is the ER membrane acetyl-CoA transporter and is essential for cell viability

Mary Cabell Jonas et al. J Cell Sci. .

Abstract

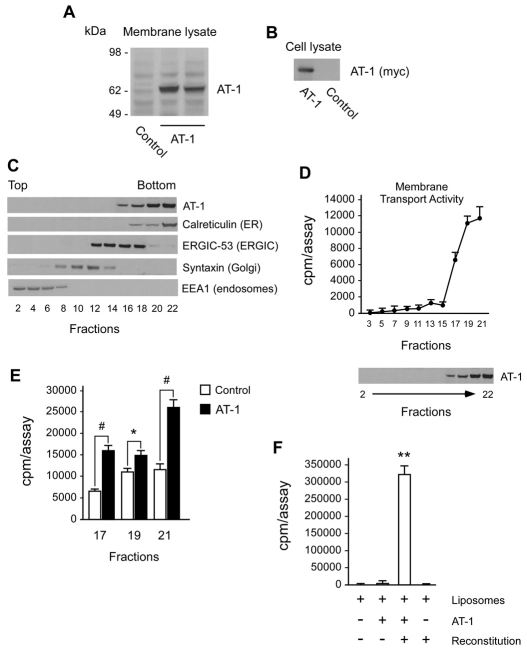
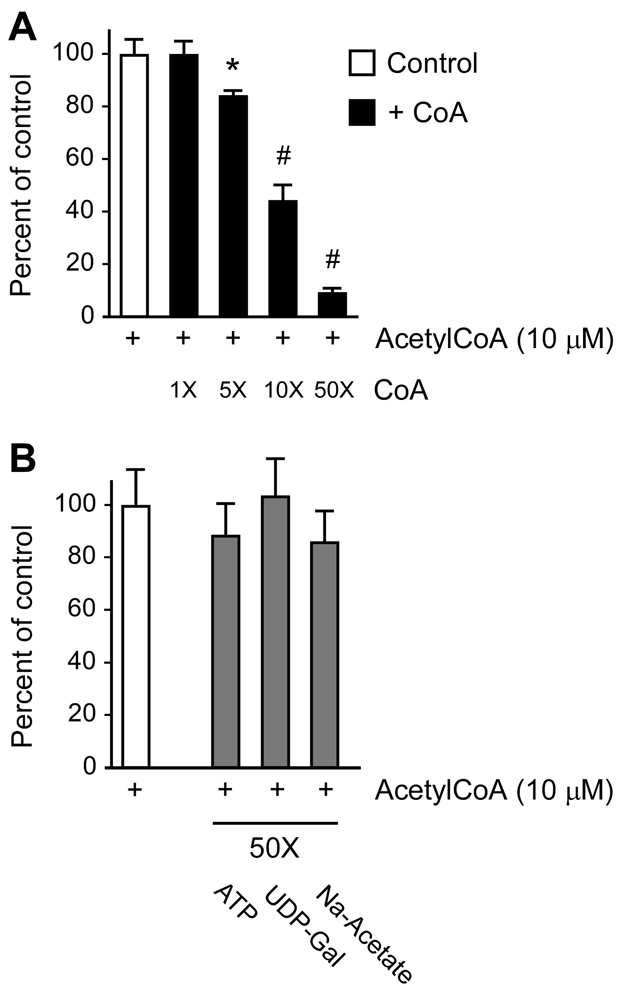
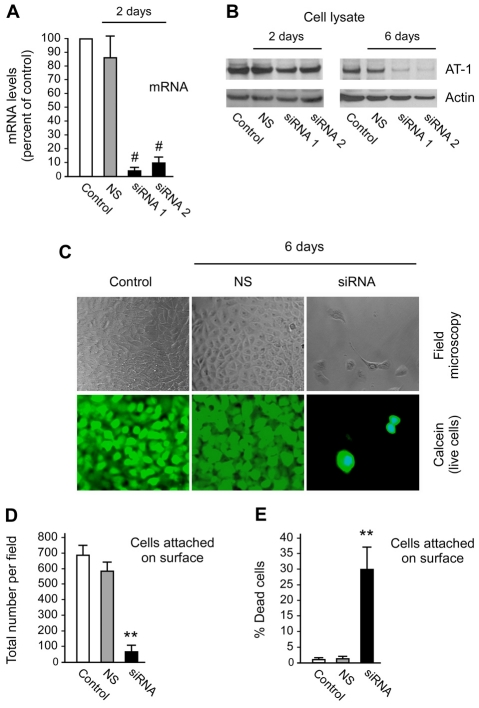
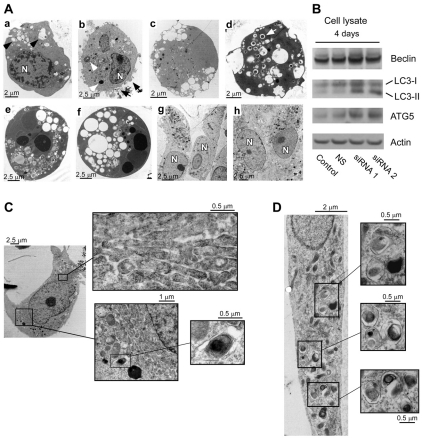
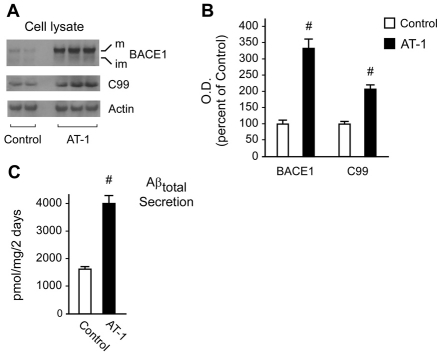
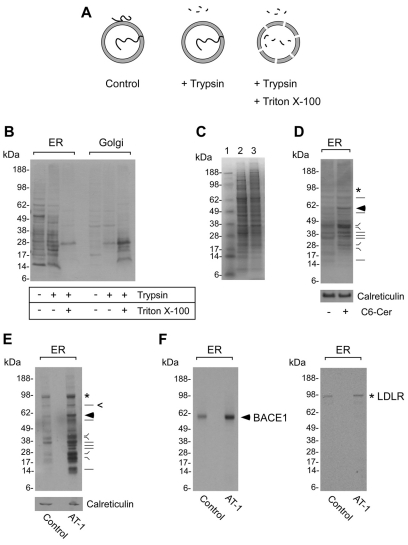
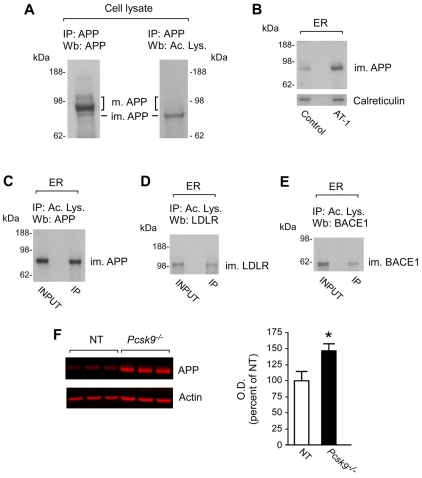
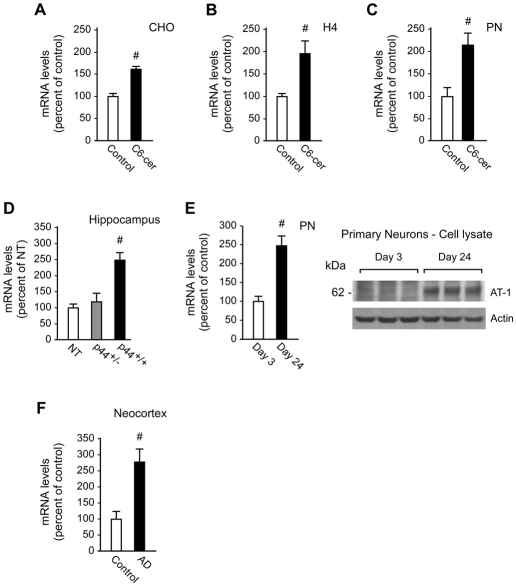
The transient or permanent modification of nascent proteins in the early secretory pathway is an essential cellular function that ensures correct folding and maturation of membrane and secreted proteins. We have recently described a new form of post-translational regulation of the membrane protein β-site APP cleaving enzyme 1 (BACE1) involving transient lysine acetylation in the lumen of the endoplasmic reticulum (ER). The essential components of this process are two ER-based acetyl-CoA:lysine acetyltransferases, ATase1 and ATase2, and a membrane transporter that translocates acetyl-CoA into the lumen of the ER. Here, we report the functional identification of acetyl-CoA transporter 1 (AT-1) as the ER membrane acetyl-CoA transporter. We show that AT-1 regulates the acetylation status of ER-transiting proteins, including the membrane proteins BACE1, low-density lipoprotein receptor and amyloid precursor protein (APP). Finally, we show that AT-1 is essential for cell viability as its downregulation results in widespread cell death and induction of features characteristic of autophagy.


Figures

Fig. 1.
Fig. 1.
AT-1 localizes in the ER and stimulates acetyl-CoA transport across the ER membrane. (A,B) Western blot analysis shows successful transfection of AT-1 into CHO cells. AT-1 migrates very close to the predicted molecular mass of 61 kDa. Transgenic AT-1 contained a Myc-His tag at the C-terminus and could be recognized with both anti-AT-1 (A) and anti-Myc (B) antibodies. (C) The subcellular distribution of transgenic AT-1 was analyzed by SDS-PAGE and immunoblotting after separation of intracellular membranes on a 10–24% discontinuous Nycodenz gradient. The appropriate subcellular markers are indicated. (D) Intracellular membranes from control CHO cells were prepared as described in C and then assayed for acetyl-CoA transport activity. Results are the average + s.d. (n=3). The distribution pattern of AT-1 as shown in C is shown here again to allow comparison with the biochemical activity of the single fractions. (E) The indicated ER fractions from control CHO cells (non-transfected) and cells stably transfected with AT-1 were assayed for acetyl-CoA transport. Results are the average + s.d. (n=3). (F) Affinity purified AT-1 was reconstituted into artificial liposomes prior to assessment of acetyl-CoA transport. Results are the average + s.d. (n=3). *P<0.05; #P<0.005; **P<0.0005.
Fig. 2.
Fig. 2.
Acetyl-CoA transport across the ER membrane is inhibited by CoA. (A) ER vesicles were assayed for acetyl-CoA transport in the presence or absence of increasing concentrations of CoA. Results are expressed as percent of control (no CoA; white bar) and are the average (n=3) + s.d. (B) The experiment described in A was repeated in the presence of ATP, UDP-galactose (UDP-Gal) or Na-acetate. *P<0.05; #P<0.005.
Fig. 3.
Fig. 3.
Downregulation of AT-1 causes cell death. (A,B) H4 cells were treated with two siRNAs targeting AT-1 prior to real-time quantification of AT-1 mRNA levels (A) and western blot analysis of endogenous AT-1 (B). Results for A are the average + s.d. (n=6). (C–E) H4 cells were treated with siRNA targeting AT-1 for 6 days and then analyzed for cell death. (C) Conventional field microscopy and calcein (green) incorporation for the visualization of living cells. (D) Direct quantification of calcein-stained cells attached on the dish after 6 days of siRNA treatment. (E) Attached cells were labeled with the Live/Dead viability Cytotoxicity Kit for Mammalian Cells for the visualization of live and dead cells. Results are expressed as percentage of dead cells over total number of cells attached to the dish. Results are the average + s.d. (n=9). NS, non-silencing siRNA; siRNA1 and siRNA2, two different siRNAs targeting AT-1. siRNA in D and E indicates the average of siRNA1 and siRNA2. #P<0.005; **P<0.0005.
Fig. 4.
Fig. 4.
The downregulation of AT-1 causes autophagic cell death. (A) H4 cells were treated with siRNA targeting AT-1 prior to transmission electron microscopy. Panels a–d show a collection of cellular features that are reminiscent of different stages of autophagic cell death. Dying cells have a spherical appearance and differ dramatically from healthy cells (panels g and h). Panels a and b show cells with cellular blebbing (black arrows), visible nuclei (labeled N) and several vacuoles (black arrowheads) together with lysosomal proliferation (white arrowheads). The nucleus displays membrane invagination and modest chromatin clustering. The chromatin clustering appears as loose speckles and irregular peripheral bundles rather than the typical apoptosis-like condensation (compare with panels e and f). Panels c and d show cells with very large vacuoles, no visible organelles and ruptures of the plasma membrane. In many cases the vacuoles contain dense lysosomal material that corresponds to autophagosomes (see panel d, white arrow). These features correspond to the classic autophagic cell death. Cells in panels a and b reflect early stages, whereas cells in panels c and d reflect late stages of the process. In rare cases (panels e and f) the vacuoles and autophagosomes were accompanied by significant chromatin condensation. In these cases the chromatin condensation differed from that observed in panels a and b, and appeared similar to the more typical apoptosis-like condensation. These cells might reflect co-activation of both autophagic and apoptotic events. Non-treated control cells are shown in panel g, whereas panel h shows cells treated with non-silencing siRNA; in both cases cells display normal features. (B) Western blot analysis of total cell lysates shows upregulation of the autophagy markers beclin, LC3-I, LC3-II and ATG5 after siRNA-mediated downregulation of AT-1. NS, non-silencing siRNA; siRNA1 and siRNA2, two different siRNAs targeting AT-1. (C,D) Transmission electron microscopy of H4 cells following siRNA-mediated downregulation of AT-1. Images show early changes, prior to the widespread autophagic cell death described in A. ER enlargement (upper panel) together with autophagosomes in close proximity of the ER membrane (lower panel) are evident in C, and severe accumulation of autophagosomes throughout the cytosol is evident in D.
Fig. 5.
Fig. 5.
Overexpression of AT-1 upregulates the steady-state level of BACE1 and the generation of Aβ. (A,B) Control CHO cells (non-transfected) and CHO cells stably transfected with AT-1 were analyzed for BACE1 levels and APP processing. A representative western blot is shown in A, whereas image quantification of changes [optical density (O.D.)] is shown in B. Results are the average + s.d. (n=6). (C) ELISA determination of total Aβ in the conditioned medium of control CHO cells and CHO cells stably transfected with AT-1. No effect was observed on the Aβtotal:Aβ42 ratio (data not shown). Results are the average + s.d. (n=3). #P<0.005.
Fig. 6.
Fig. 6.
Overexpression of AT-1 results in increased acetylation of ER proteins. (A,B) Intact ER and Golgi vesicles were digested with trypsin for 30 minutes at 25°C, in the presence or absence of 0.05% Triton X-100. Digestion was halted by adding an anti-trypsin-specific inhibitor. Triton X-100 was added to allow access of trypsin to the lumen of the vesicles. A schematic view of the rationale of this experiment is shown in A. Proteins were separated by SDS-PAGE and analysed by western blotting using an antibody against acetylated lysine. (C) The protein profile of the ER and Golgi vesicles used in B was assessed by SDS-PAGE and Coomassie staining. Lane 1, molecular markers; lane 2, ER; lane 3, Golgi complex. (D) Western blot assessment of the lysine-acetylation profile of intact ER vesicles purified from control (non-treated) and ceramide-treated (C6-cer; 10 μM) cells. Cells used here did not overexpress AT-1. The ER protein calreticulin was used as loading control. (E,F) Western blot assessment of the lysine-acetylation profile of intact ER vesicles purified from control (non-transfected) and AT-1 overexpressing cells. The membrane was initially blotted with an antibody against acetylated lysine (E) and then with antibodies against BACE1 (F, left panel) and LDLR (F, right panel). The ER protein calreticulin was used as loading control.
Fig. 7.
Fig. 7.
APP is a substrate of the ER-based acetylation machinery. (A) Total cell lysates were immunoprecipitated with an anti-APP antibody and then analyzed with both anti-APP (left panel) and anti-acetylated lysine (right panel) antibodies. Only the ER-based nascent form of APP (im. APP, immature APP) was acetylated; m. APP, mature forms of APP. (B) Protein extracts from highly purified ER vesicles of control (non-transfected) and AT-1 overexpressing cells were analyzed for APP levels by western blot. The ER protein calreticulin was used as loading control. (C) Protein extracts from highly purified ER vesicles were immunoprecipitated with an antibody against acetylated lysine and then analyzed by western blotting using anti-APP antibody. (D,E) The experiment described in C was repeated with LDLR (D) and BACE1 (E) to show that APP behaves as LDLR and BACE1, currently the only two known membrane proteins undergoing transient acetylation in the lumen of the ER. im. LDLR, immature form of LDLR; im. BACE1, immature form of BACE1. (F) APP levels in the neocortex of non-transgenic (NT) and Pcsk9−/− animals were analyzed by immunoblotting with an anti-APP antibody. Imaging was performed with the LiCor Odyssey Infrared Imaging System. A representative western blot is shown in the left panel, and image quantification of changes [optical density (O.D.)] is shown in the right panel. Results are the average + s.d. (n=9). *P<0.05.
Fig. 8.
Fig. 8.
AT-1 is upregulated by ceramide treatment of cultured cells and under conditions that are typically associated with high levels of endogenous ceramide. (A) CHO cells were treated with ceramide (C6-cer; 10 μM) prior to quantitative real-time PCR. Gene expression levels were normalized against GAPDH and results are expressed as percent of control + s.e.m. (n=5). (B) The experiment described in A was repeated in H4 cells. Gene expression levels were normalized against GAPDH and results are expressed as percent of control + s.e.m. (n=5). (C) The experiment described in A was repeated in cultured neurons (PN, primary neurons). Gene expression levels were normalized against actin and results are expressed as percent of control + s.e.m. (n=5). (D) Real-time determination of AT-1 mRNA in the hippocampus of non-transgenic (NT), p44+/− and p44+/+ transgenic mice. Gene expression levels were normalized against actin and results are expressed as percent of control + s.e.m. (n=4). (E) Hippocampal neurons were cultured in vitro for 3 and 24 days prior to real-time mRNA (left panel) and western blot (right panel) analysis of endogenous AT-1 levels. Gene expression levels were normalized against actin and results are expressed as percent of day 3 (n=10) + s.e.m. (F) cDNA produced from brain tissue (frontal cortex) of late-onset AD patients (n=5) and age-matched controls (n=5) was analyzed by quantitative real-time PCR. Results were normalized against GAPDH and are expressed as percent of age-matched controls + s.e.m. #P<0.005.

References

    1. Abisambra J. F., Fiorelli T., Padmanabhan J., Wefes I., Neame P., Goodwin B., Norden M., Potter H. (2009). APP over-expression affects the localization of PCSK9 and LDLR. Program no. 43.5/D26, Society for Neuroscience 2009 Annual Meeting, Chicago, IL
    1. Axe E. L., Walker S. A., Manifava M., Chandra P., Roderick H. L., Habermann A., Griffiths G., Ktistakis N. T. (2008). Autophagosome formation from membrane compartments enriched in phosphatidylinositol 3-phosphate and dynamically connected to the endoplasmic reticulum. J. Cell Biol. 182, 685-701 - PMC - PubMed
    1. Bernales S., McDonald K. L., Walter P. (2006). Autophagy counterbalances endoplasmic reticulum expansion during the unfolded protein response. PLoS Biol. 4, e423 - PMC - PubMed
    1. Berninsone P. M., Hirschberg C. B. (2000). Nucleotide sugar transporters of the Golgi apparatus. Curr. Opin. Struct. Biol. 10, 542-547 - PubMed
    1. Carey D. J., Hirschberg C. B. (1981). Topography of sialoglycoproteins and sialyltransferases in mouse and rat liver Golgi. J. Biol. Chem. 256, 989-993 - PubMed

Publication types

MeSH terms

Substances